
Fig. S6
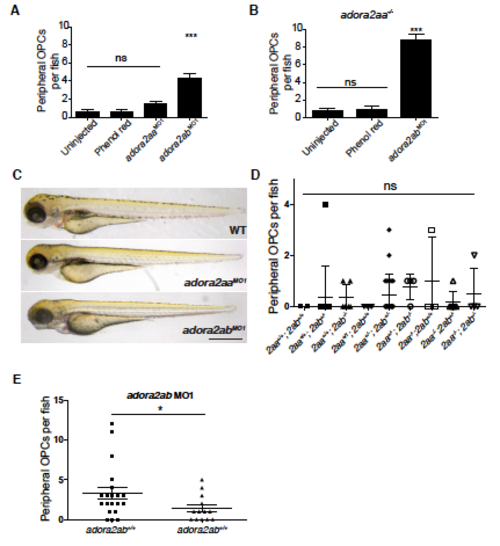
Knockdown of adora2ab, but not adora2aa, results in peripheralmOPCs. (A) Mean ± SEM of peripheral OPCs in WT olig2:dsred embryos injected with vehicle, 1 ng/nl adora2aa MO1 or 1 ng/nl adora2ab MO1. n = 42 (WT), n = 11 (phenol red), n = 65 (adora2aa MO1) and n = 42 (adora2ab MO1). ***p<0.0001 adora2ab MO1 compared to uninjected. (B) Mean ± SEM of peripheral OPCs at 3 dpf in olig2:dsred;adora2aa-/- larvae injected with adora2ab MO1. n = 44 (uninjected), n = 30 (phenol red) and n = 84 (adora2ab MO1). ***p<0.0001 compared to uninjected. (C) Brightfield images of 3 dpf WT, adora2aa and adora2ab morphant larvae. (D) Mean ± SEM of peripheral OPCs at 3 dpf in olig2:dsred;adora2aa-/-;adora2ab-/- larvae. p=0.75, n = 2 (adora2aa+/+;adora2ab+/+), n = 11 (adora2aa+/+; adora2ab+/-), n = 6 (adora2aa+/+; adora2ab-/-), n = 8 (adora2aa+/-; adora2ab+/+), n = 20 (adora2aa+/-; adora2ab+/-), n = 4 (adora2aa+/-; adora2ab-/-), n = 3 (adora2aa-/-; adora2ab+/+), n = 6 (adora2aa-/-; adora2ab+/-) and n = 4 (adora2aa-/-; adora2ab-/-). Scale bar, 0.5 mm. (E) Mean ± SEM of peripheral OPCs at 3 dpf in olig2:dsred;adora2ab-/- and adora2ab+/+ larvae injected with 1ng/nl adora2ab MO at the one-cell stage. *p = 0.03, n = 20 (adora2ab+/+); n = 13 (adora2ab-/-). |