
Fig. 1
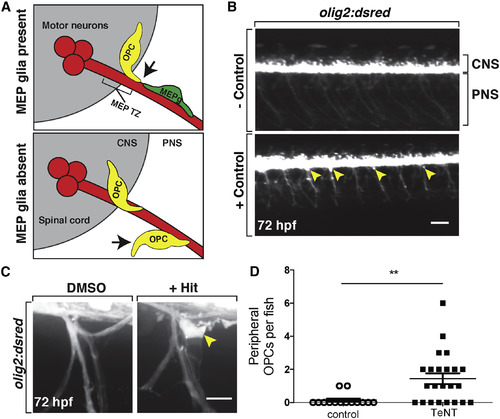
Small-Molecule Screen Identifies Compounds that Disrupt OPC Migration at the MEP TZ (A) Schematic of a transverse view of the MEP TZ. MEP glia (MEPg; green) prevent OPC (yellow) exit from the spinal cord (gray). OPC processes (arrow) contact MEP glia but are repelled. Without MEP glia, OPCs migrate onto peripheral nerves. (B) Low-magnification images showing lateral views of negative (top) and positive (bottom) controls at 3 dpf in olig2:dsred larvae. Peripheral olig2+ cells are denoted with yellow arrowheads. (C) Images of control and validated hits in 3 dpf olig2:dsred larvae showing ectopic OPCs (arrowhead) along spinal motor nerves. (D) Mean ± SEM of peripheral OPC count for larvae injected with injection buffer (control) or TeNT mRNA at 3 dpf. p = 0.0013; n = 14 control, n = 23 TeNT. Scale bars, 100 μM in (B) and 20 μM in (C). |
| Gene: | |
|---|---|
| Fish: | |
| Condition: | |
| Anatomical Terms: | |
| Stage: | Protruding-mouth |
| Fish: | |
|---|---|
| Condition: | |
| Observed In: | |
| Stage: | Protruding-mouth |