
Fig. 3
- ID
- ZDB-FIG-190812-33
- Publication
- Chen et al., 2019 - Cerebrovascular Injuries Induce Lymphatic Invasion into Brain Parenchyma to Guide Vascular Regeneration in Zebrafish
- Other Figures
- All Figure Page
- Back to All Figure Page
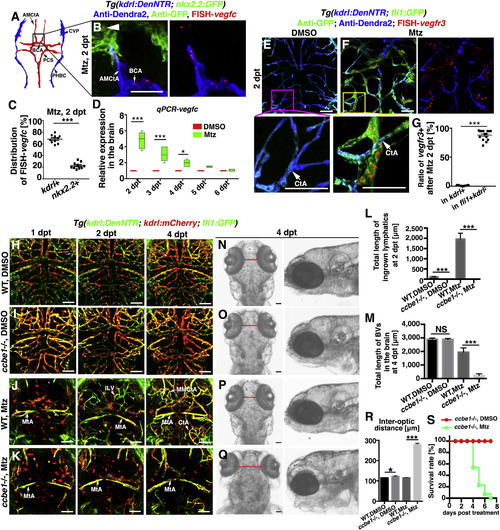
Ingrowth of Meningeal Lymphatics Is Dependent on the Locally Activated Vegfc (A–D) Illustration of brain vascular network in lower middle layer indicates the position of vessels in (B) Expression of vegfc at 2 dpt (B) (n = 30/34). Approximately 68% and 22% of the FISH-vegfc signals are distributed in the BECs and nkx2.2+ neurons (B, arrowhead), respectively (C) (n = 10). Two-tailed unpaired t test, p < 0.0001. RT-qPCRs using dissected brain tissues show the relative expression levels of vegfc in the brain at 2–6 dpt (D) (n = 5). Two-way ANOVA by Dunnett’s multiple comparisons test. DMSO, 2 dpt versus Mtz, 2 dpt, p < 0.0001; DMSO, 3 dpt versus Mtz, 3 dpt, p < 0.0001; DMSO, 4 dpt versus Mtz, 4 dpt, p = 0.0119). Dorsal view, anterior upward. Scale bar, 50 μm. See also Figure S3. (E–G) In contrast to the absence of vegfr3 in the control (E) (n = 18/20), vegfr3 is exclusively expressed in the fli1+kdrl- LECs at 2 dpt (F) (n = 17/22). Higher magnification images of the framed areas (CtAs, arrows) are displayed. The statistics show the ratios of vessels positive for vegfr3 (G) (n = 15). Two-tailed unpaired t test, p < 0.0001. Ventral view, anterior upward. Scale bar, 50 μm. See also Figure S3. (H–M) Brain vascular development was unaffected in the ccbe1 mutant (I) (n = 14/14) in contrast to the wild type (WT) (H) (n = 22/22). After Mtz treatment, meningeal lymphatic ingrowth (fli1+kdrl−) and neoangiogenesis (kdrl+) did not occur in the ccbe1mutant (K) (n = 23/27) in contrast to the wild type (J) (n = 36/40). Red spots in (J) and (K) represents endocytosed kdrl:mCherry red fluorescence by macrophages. The quantifications show the total lengths of the ingrown lymphatics at 2 dpt (L) (n = 60). Two-tailed unpaired t test. All p < 0.0001 and nascent blood vessels (BV) at 4 dpt (M) (n = 6). Two-tailed unpaired t test, WT, DMSO versus ccbe1−/−, DMSO, p = 0.8383; WT, Mtz versus ccbe1−/−, Mtz, p < 0.0001). Dorsal view, anterior upward. Scale bar, 50 μm. (N–S) The absence of ingrown lymphatics causes severe cerebral edema. The bright field images of dorsal and lateral views of zebrafish head at 4 dpt (N–Q). In contrast to the wild type with DMSO treatment (N) (n = 32/32), the ccbe1 mutant exhibited slight cerebral edema (O) (n = 24/24) indicated as the inter-optic distance (red lines). At 4 dpt after Mtz treatment, significantly enlarged inter-optic distance in the ccbe1 mutant (Q) (n = 18/18) indicated severe cerebral edema in contrast to the wild type (P) (n = 18/18), confirmed by statistical analysis (R) (n = 9). Two-tailed unpaired t test, WT, DMSO versus ccbe1−/−, DMSO, p = 0.0209; WT, Mtz versus ccbe1−/−, Mtz, p < 0.0001). The survival rate of ccbe1 mutant from 0 to 8 dpt with and without Mtz treatment (S) (n = 10). Data are represented as mean ± SEM. ∗∗∗p < 0.001, ∗p < 0.05, NS, not significant. Scale bar, 50 μm. AMCtA, anterior (rostral) mesencephalic central artery; BCA, basal communicating artery; CtA, central artery; CVP, choroidal vascular plexus; iLV, ingrown lymphatic vessels; MMCtA, middle mesencephalic central artery; MtA, metencephalic artery; PCS, posterior (caudal) communicating segment; PHBC, primordial hindbrain channel. |
Reprinted from Developmental Cell, 49(5), Chen, J., He, J., Ni, R., Yang, Q., Zhang, Y., Luo, L., Cerebrovascular Injuries Induce Lymphatic Invasion into Brain Parenchyma to Guide Vascular Regeneration in Zebrafish, 697-710.e5, Copyright (2019) with permission from Elsevier. Full text @ Dev. Cell