FIGURE

Figure 2

ID
ZDB-FIG-190723-2201
Publication
Marachlian et al., 2018 - Principles of Functional Circuit Connectivity: Insights From Spontaneous Activity in the Zebrafish Optic Tectum
Other Figures
All Figure Page
Back to All Figure Page
Figure 2

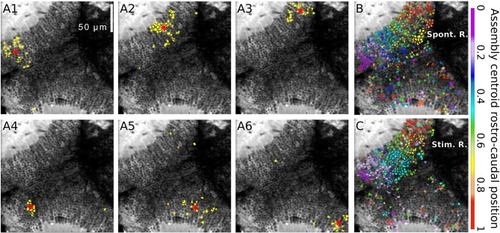
Spontaneously emerging neuronal assemblies. (A1–6) Topographies of six examples of spontaneous neuronal assemblies. The neurons belonging to each of the assemblies are labeled in yellow. Red asterisks: assembly centroids. (B) Example of the spontaneously emerging spatial organization where all the spontaneous assemblies whose centroids lay on the right tectum. Neurons belonging to assemblies with similar topographic centroids were similarly colored. The colors represent the average normalized rostro-caudal centroid position of their assemblies. (C) The same representation for the light-spot-induced responses. Note the resemblance between (B,C), showing a graded change in colors along the rostro-caudal axes. Scalebars: 50 μm (reproduced with permission from Romano et al., 2015).

Expression Data

Expression Detail
Antibody Labeling
Phenotype Data

Phenotype Detail
Acknowledgments
This image is the copyrighted work of the attributed author or publisher, and ZFIN has permission only to display this image to its users. Additional permissions should be obtained from the applicable author or publisher of the image. Full text @ Front. Neural Circuits