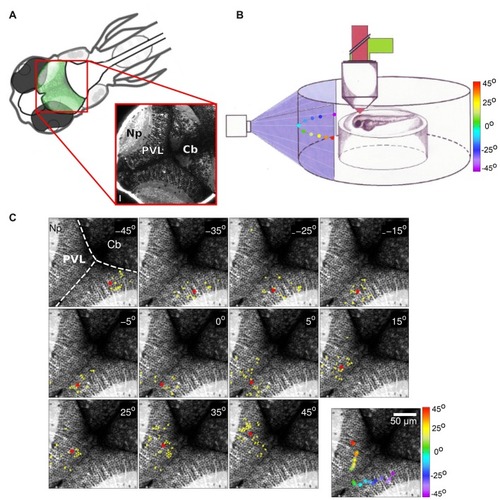
(A) Top left: schematic dorsal view of an 8-days-post-fertilization (dpf) zebrafish larva. The optic tectum is indicated in green. Bottom right: optical section of a Tg(huC:GCaMP5G) zebrafish larva showing pan-neuronal GCaMP5 expression corresponding to the area in the top left scheme (red rectangle). The image was obtained using a two-photon microscope. PVZ, Periventricular layer; Np, neuropil; Cb, cerebellum. Scalebar: 15 μm (reproduced with permission from Pietri et al., 2017). (B) Schematic drawing of an agarose-embedded zebrafish larvae in the recording chamber. The colored dots represent the different stimuli positions projected on a screen (color scale). (C) Examples of neuronal groups consistently activated by light spots at different positions in the field of view of the larva (azimuth angle, top right corner). Activated neurons are colored in yellow, and the neuronal groups’ centroids are depicted as red asterisks. Top left: anatomical landmarks. Dashed lines delineate the tectal-cerebellar and inter-hemispheric tectal boundaries. Cb, cerebellum; Np, tectal neuropil; PVL, periventricular layer. Bottom right panel: the centroids colored according to the azimuth angle (color bar on the right). The centroids evenly tile the contra-lateral rostro-caudal (reproduced with permission from Romano et al., 2015).

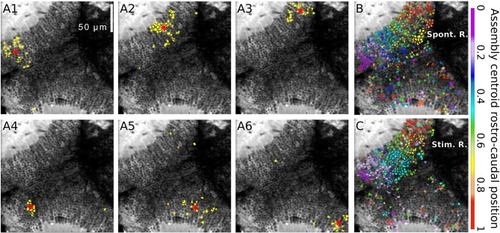
Spontaneously emerging neuronal assemblies. (A1–6) Topographies of six examples of spontaneous neuronal assemblies. The neurons belonging to each of the assemblies are labeled in yellow. Red asterisks: assembly centroids. (B) Example of the spontaneously emerging spatial organization where all the spontaneous assemblies whose centroids lay on the right tectum. Neurons belonging to assemblies with similar topographic centroids were similarly colored. The colors represent the average normalized rostro-caudal centroid position of their assemblies. (C) The same representation for the light-spot-induced responses. Note the resemblance between (B,C), showing a graded change in colors along the rostro-caudal axes. Scalebars: 50 μm (reproduced with permission from Romano et al., 2015).

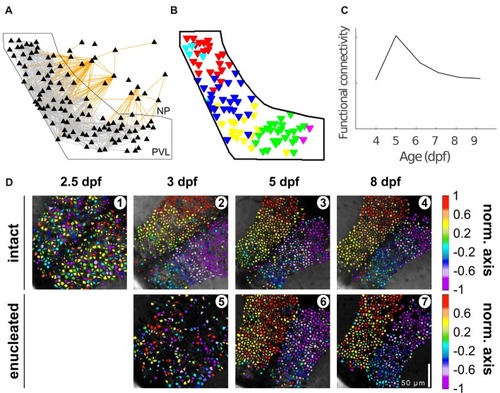
Tectal functional connectivity and neuronal assembly characteristics change over development. (A) Representation of the optic tectum as a graph. Each node (triangle) represents a neuron, and each edge represents correlation exceeding a threshold, i.e., functional connectivity between two neurons (gray lines for intra-PVL edges and orange lines for edges involving NP neurons). The solid black outline shows the boundary of the PVL. (B) Six communities (color coded) were detected in the graph presented in (A). (C) Functional connectivity metrics peaked at 5 dpf and declined afterwards. (D) Examples of the spatial organization of the spontaneous activity along the caudo-rostral axis of an intact (1–4) and enucleated larva (5–7) at different developmental stages. Scale bar represents 100 mm. Color bar: position along the caudo-rostral axis (the neurons are color coded according to the centroid azimuthal position of the assembly to which they belong; reproduced with permission from Avitan et al., 2017; Pietri et al., 2017).

Acknowledgments
This image is the copyrighted work of the attributed author or publisher, and ZFIN has permission only to display this image to its users. Additional permissions should be obtained from the applicable author or publisher of the image. Full text @ Front. Neural Circuits