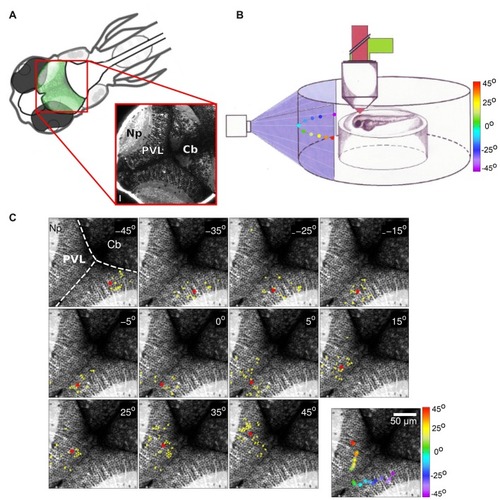
(A) Top left: schematic dorsal view of an 8-days-post-fertilization (dpf) zebrafish larva. The optic tectum is indicated in green. Bottom right: optical section of a Tg(huC:GCaMP5G) zebrafish larva showing pan-neuronal GCaMP5 expression corresponding to the area in the top left scheme (red rectangle). The image was obtained using a two-photon microscope. PVZ, Periventricular layer; Np, neuropil; Cb, cerebellum. Scalebar: 15 μm (reproduced with permission from Pietri et al., 2017). (B) Schematic drawing of an agarose-embedded zebrafish larvae in the recording chamber. The colored dots represent the different stimuli positions projected on a screen (color scale). (C) Examples of neuronal groups consistently activated by light spots at different positions in the field of view of the larva (azimuth angle, top right corner). Activated neurons are colored in yellow, and the neuronal groups’ centroids are depicted as red asterisks. Top left: anatomical landmarks. Dashed lines delineate the tectal-cerebellar and inter-hemispheric tectal boundaries. Cb, cerebellum; Np, tectal neuropil; PVL, periventricular layer. Bottom right panel: the centroids colored according to the azimuth angle (color bar on the right). The centroids evenly tile the contra-lateral rostro-caudal (reproduced with permission from Romano et al., 2015).
|
