|
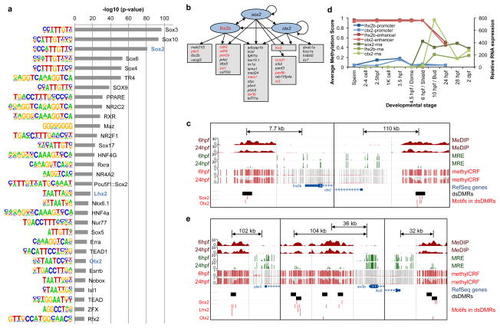
Gene regulatory network derived by dsDMRs(a) Enriched transcription factor binding motifs in dsDMRs and their hypergeometric p-values from HOMER62. On the left sequence logo of each motif was displayed. The three motifs used in eye development regulatory network construction were indicated by blue colored text. The motifs with p-values less than 10−10 were displayed here, and the full list of enriched motifs was in Supplementary Fig. 13. (b) The putative gene regulatory network of the eye development derived from dsDMR analysis. The blue ovals were transcription factors whose motifs were enriched in dsDMRs. The genes in the grey boxes were the target genes identified in GREAT analysis. Arrows indicates that the transcription factors had their binding motifs in neighboring dsDMRs of the target genes. The genes colored in red were known sox2 target genes identified from ChEA68. (c) The gene set view of 4 genomic regions (chr8:3242750–3245750, chr8:3250489–3253489, chr17:44294595–44297595, chr17:44405250–44408250) from the Epigenome browser69,70. The left panel displayed the regions around lhx2b promoter and its nearby dsDMR enhancer (indicated by the black box). The right panel displayed the regions around otx2 promoter and its nearby dsDMR enhancer. Both dsDMRs had Sox2 and Otx2 binding motifs (red ticks), suggesting that sox2 could be an upstream regulator of these two TFs. (d) The methylation profiles of the lhx2b and otx2 promoters and their neighboring dsDMR enhancers (blue and red lines, left y-axis) and the expression profile of the two genes (green lines, right y-axis). Each gene expression level was normalized to the expression level of 1K-cell stage. (e) The gene set view of 7 genomic regions (chr13:6556250–6559250, chr13:6658232–6661232, chr13:29912750–29915750, chr13:29935250–29940750, chr13:29993060–29996060, chr13:30062750–30065750, chr13:30077750–30080750) from the Epigenome browser69,70. The displays of pitx3 (left), six3b (middle) and lhx5 (right) promoters and their nearby dsDMR enhancers were as in (c).
|