|
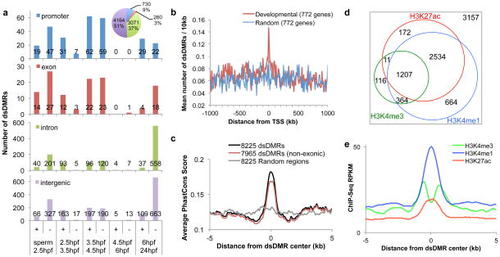
Identification of the developmental stage-specific differentially methylation regions (dsDMRs)(a) The number of dsDMRs identified between neighboring developmental stages as indicated on x-axis. Plus sign (+) indicates dsDMRs with increasing DNA methylation levels with respect to step-wise developmental stages, and minus sign (−) indicates dsDMRs with decreasing DNA methylation. The genomic locations of dsDMRs were indicated by different colors. Pie chart: the genomic locations of all DMRs identified in pair-wise comparisons. (b) The distribution of dsDMRs around genes related to embryo development (red) or around random genes (blue). (c) Sequence conservation of dsDMRs. Vertebrate PhastCons scores of the dsDMRs and their flanking 10 kb regions were averaged and plotted. (d) A weighted Venn diagram of the number of dsDMRs overlapping with histone modification peaks from any developmental stages. (e) Histone modification signature of dsDMRs. Average histone modification ChIP-seq RPKM values from 24 hpf embryos were plotted over 10 kb regions centered on dsDMRs.
|