FIGURE

Figure 3

ID
ZDB-FIG-190723-1640
Publication
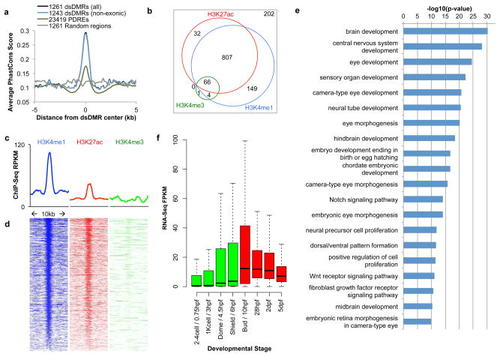
Lee et al., 2015 - Developmental enhancers revealed by extensive DNA methylome maps of zebrafish early embryos
Other Figures
All Figure Page
Back to All Figure Page
Figure 3

Most dsDMRs with decreasing DNA methylation level between 6 hpf and 24 hpf are developmental enhancers

(a) Averaged vertebrate PhastCons scores of 10kb regions centered on dsDMRs were plotted. (b) A weighted Venn diagram of dsDMRs overlapping with different histone modification peaks from 24 hpf embryo. (c) Histone modification signature of dsDMRs. Average ChIP-seq RPKM values from 24 hpf embryos were plotted over 10 kb regions centered on the dsDMRs. (d) Heat maps of ChIP-seq signal over 10 kb regions centered on individual dsDMRs. (e) Enriched GO terms and their binomial p-values from analyzing dsDMRs using GREAT42. The top 20 GO terms were displayed here and the full list of GO terms enriched was in Supplementary Fig. 11a. (f) Expression profiles of genes associated with dsDMRs from GO enrichment analysis across different developmental stages.

Expression Data

Expression Detail
Antibody Labeling
Phenotype Data

Phenotype Detail
Acknowledgments
This image is the copyrighted work of the attributed author or publisher, and ZFIN has permission only to display this image to its users. Additional permissions should be obtained from the applicable author or publisher of the image. Full text @ Nat. Commun.