|
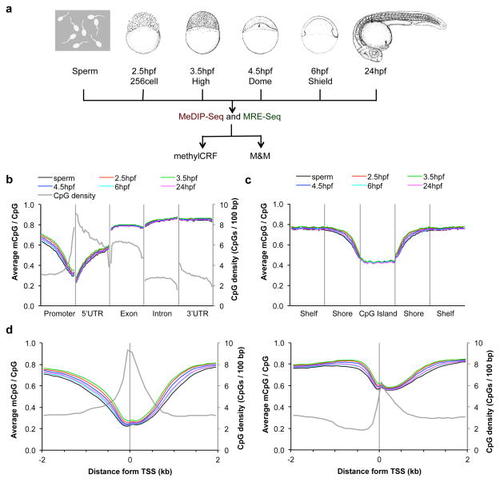
Global features of DNA methylation across zebrafish embryogenesis(a) A schematic representation of the study. MeDIP-seq and MRE-seq libraries were constructed from genomic DNA of six developmental stages: sperm, 2.5 hpf, 3.5 hpf, 4.5 hpf, 6 hpf and 24 hpf. Stage-specific drawings of representative embryos are adapted from ref 26 with permission from Wiley-Liss, Inc. © 1995. The two sequencing libraries for each developmental stage were further processed and analyzed using recently developed algorithms, methylCRF and M&M. Both algorithms integrate MeDIP-seq and MRE-seq data. (b–d) The average DNA methylation level across different genomic features: gene-associated regions (b), CpG islands and neighboring regions (c), and high and low CpG density promoters (d). Promoter was defined as 1 kb upstream from TSS in (b). CpG island shore was defined as 2 kb regions flanking a CpG island, and CpG shelf as a 2 kb region outside a CpG shore (away from the CGI). The average CpG densities (grey lines) over the regions was also plotted in (b) and (d).
|