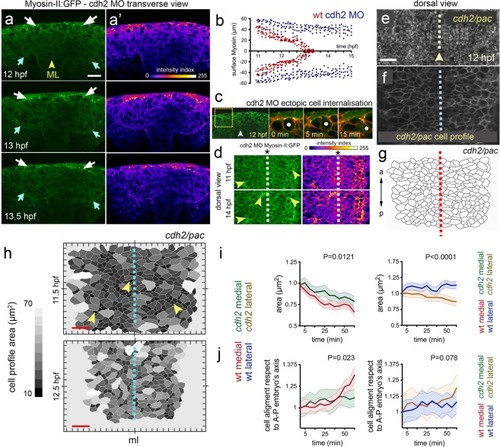
Cdh2 is required to organise midline Myosin-II during internalisation. (a) Frames from a transverse confocal time-lapse showing surface distribution of Myosin-II:GFP during cdh2 MO deficient neural plate internalisation (left panel). White arrows show surface Myosin-II:GFP distribution, while cyan arrows indicate basal Myosin-II:GFP accumulation. (a’) Fire lookup table indicating intensity values (0–255). (b) Comparative quantification of medio-lateral surface Myosin-II:GFP distribution between wild-type (red) and cdh2 MO (blue) during internalisation (nembryos = 5 wt, 4 cdh2 MO, P < 0.0001). (c) Representative example of ectopic cell internalisation in cdh2 MO (nembryos = 3, nectopic cells internalisation = 28). (d) Left panels: single dorsal confocal frames showing abnormal midline Myosin-II:GFP distribution in cdh2 MO embryos (arrowheads). Right panels: fire lookup table, showing intensity profile. Dashed line represent midline. (e–g) Dorsal picture of cdh2 MO neural plate. (e) Bright field dorsal view images in cdh2/pac tissue by 12 hpf. Scale bar is 20 µm. (f) Single dorsal confocal slice depicting cells’ dorsal area profiles in cdh2/pac neural plate labelled with membrane-GFP (gray). (g) Automated cell area profile reconstruction from (f). a = anterior, p = posterior. Arrowhead and dashed lines in (e–g) represent tissue midline. (h) Cdh2/pac mutant dorsal cell surface profiles during defective internalisation. Arrowheads indicate cell constriction events and dashed line represent tissue midline (ml). Scale bar, 10 µm and time is in hpf. (i–j) Quantification of dorsal cell area profiles during cdh2/pac mutant internalisation. (i) Mean cell surface area between medial (wt red, cdh2/pac green left, P = 0.0121), and lateral cells (wt blue, cdh2/pac orange, P < 0.0001). (j) Comparative cell aligment along the anterior-posterior embryo’s axis between medial (wt red, cdh2/pac green left, P = 0.023), and lateral cells (wt blue, cdh2/pac orange, P = 0.078).
|
