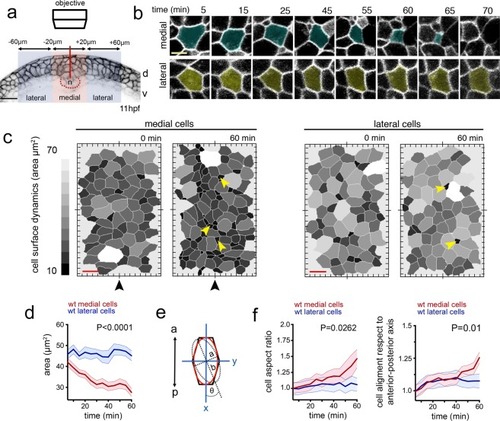
Dorsal cell surface dynamics during internalisation. (a) Schematic of the imaging approach to visualise dorsal cell surface profile during convergence and internalisation. Inverted LUT image depicts cell membrane outlines. D is dorsal, v is ventral, and n is notochord. Scale bar is 20 µm. (b) Tangential z-slices 5–7 µm below EVL were selected for automated segmentation of dorsal surface of superficial neural plate cells. Top panels: image of dorsal surface of medial cell over time (pseudocoloured in cyan). Bottom panels: images of dorsal surface of lateral cell over time (pseudocoloured in yellow). Scale bar, 5 µm and time is in minutes. (c) Dorsal surface profiles of medial and lateral populations of cells one hour apart. For simplicity only half of the neural plate is shown. Colour code indicates relative dorsal surface profile area in µm2, darker greys are smaller than lighter greys. Black arrowhead indicates midline position. Scale bar, 10 µm. (d) Mean dorsal surface area of medial (red) and lateral (blue) cells over time (nembryos = 4 wt analysed, P < 0.0001). (e) Schematic representation of a cell’s dorsal surface area to illustrate cell aspect ratio and alignment of this surface area to the anteroposterior axis of the embryo. (f) Quantification of surface aspect ratio and alignment to embryonic axis. In all graphs error bars indicate SEM.
|
