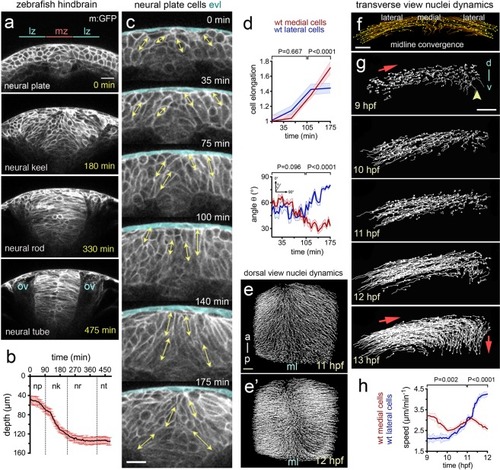
Cell and tissue dynamics during zebrafish neural plate internalisation. (a) Four transverse view confocal images depicting the neural plate, keel, rod and tube stages of wild-type zebrafish neurulation at hindbrain levels. Cells membranes labelled with CAAX-GFP. Scale bar is 20 µm and OV indicates otic vesicle as hindbrain landmark. The medial zone (mz) and lateral zone (lz) of the neural plate are indicated in (a) and each is 20 µm wide. (b) Time course showing depth of the neural anlage at the midline. Internalisation deepens the neural anlage by approximately 300% in the plate to keel transition (initial thickness ~42 µm on average vs final thickness ~138 µm on average, nembryos = 4). np, neural plate; nk, neural keel; nr, neural rod; and nt, neural tube. (c) Frames from transverse view time-lapse to illustrate cell profile changes during plate to keel transition. Double headed arrows illustrate examples of measurements of the long axis of cells used to quantify cell elongation. EVL (enveloping cell layer) is highlighted in pale blue. (d) Quantification of cell elongation and cell angle in medial and lateral zones during plate to keel transition. (e and e’) Projected views from dorsal surface of nuclei tracks at 11 hpf and 12 hpf. Nuclei tracked from movies of cells labelled with H2B-GFP. (f) Transverse view image of nuclei tracked during convergence to midline (10.5 hpf). Scale bar, 20 µm. (g) Transverse views of nuclei tracks of neural plate dynamics during convergence and internalisation (9–13 hpf, for simplicity only half of the neural plate is illustrated). Red arrows indicate tissue movement, and arrowhead indicates midline position. D, indicates dorsal, while v, indicates ventral. (h) Quantification of nuclei speeds for medial and lateral cells during convergence and internalisation (nembryos = 3, naverage of medial cells analysed = 90, naverage of lateral cells analysed = 80, 5 z-slice analysed in each embryo).
|
