
Fig. 2
- ID
- ZDB-FIG-190712-4
- Publication
- Liu et al., 2019 - Network Properties Revealed during Multi-Scale Calcium Imaging of Seizure Activity in Zebrafish
- Other Figures
- All Figure Page
- Back to All Figure Page
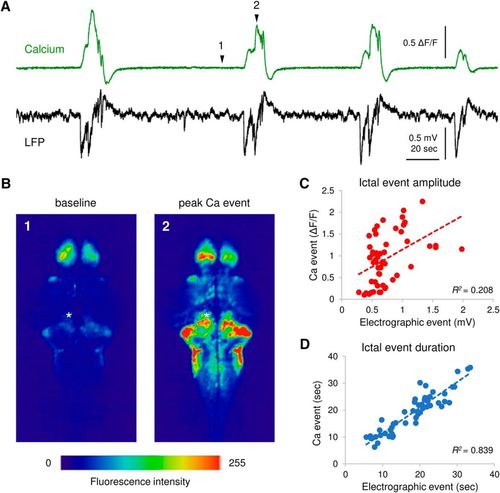
Correlation between LFP and calcium transients. A, Representative simultaneous calcium traces (green) from the cerebellum and LFP (black) recorded from optic tectum/cerebellum with recurrent PTZ-induced ictal-like seizures. Scale bars as indicated in figure. B, Fluorescence images of calcium activity during baseline and peak ictal-like event. The intensity of fluorescence is color coded as shown in the color bar. Events 1 and 2 as noted in A. Asterisk indicates the LFP recording site. C, D, Correlation between LFP and calcium transients in ictal-like event amplitude (C) and duration (D). Corresponding correlation coefficient R 2 is indicated in figure; n = 54 events from 10 PTZ-treated larvae. |
| Fish: | |
|---|---|
| Condition: | |
| Observed In: | |
| Stage Range: | Day 5 to Day 6 |