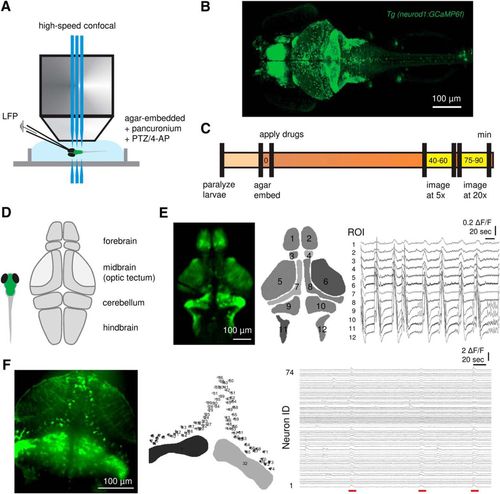
High-speed confocal calcium imaging at different scales. A, Experimental setup. Simultaneous LFP recording and fast confocal imaging (20–30 fps) in agar-embedded larval zebrafish exposed to pancuronium (300 µM) with PTZ (10 mM) or 4-AP (4 mM). B, Representative high-resolution imaging of neurod1:GCaMP6f expressed larval zebrafish on 5–6 dpf. C, Experimental workflow. Recordings were obtained ∼40 min after drug application, and 5× and 20× objectives were used for whole-brain and neuron-level imaging, respectively. D, Schematic illustration depicting sub-regions of the larval zebrafish brain. E, ROIs and representative calcium traces (ΔF/F) of PTZ-induced ictal-like events; 1, 2: pallium; 3, 4: habenula; 5, 6: neuropil; 7, 8: SPV; 9, 10: cerebellum; 11, 12: hindbrain. F, Neuronal microcircuits within optic tectum and representative calcium traces of individual SPV neurons with PTZ-induced ictal-like event break-ins (underlined in red). Cerebellum was included as an indicator of ictal-like events that involve all brain regions. Scale bars as indicated in figure.
|
