
- Title
-
Network Properties Revealed during Multi-Scale Calcium Imaging of Seizure Activity in Zebrafish
- Authors
- Liu, J., Baraban, S.C.
- Source
- Full text @ eNeuro
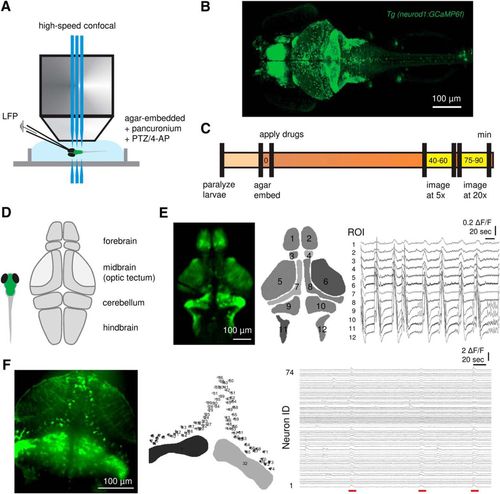
High-speed confocal calcium imaging at different scales. A, Experimental setup. Simultaneous LFP recording and fast confocal imaging (20–30 fps) in agar-embedded larval zebrafish exposed to pancuronium (300 µM) with PTZ (10 mM) or 4-AP (4 mM). B, Representative high-resolution imaging of neurod1:GCaMP6f expressed larval zebrafish on 5–6 dpf. C, Experimental workflow. Recordings were obtained ∼40 min after drug application, and 5× and 20× objectives were used for whole-brain and neuron-level imaging, respectively. D, Schematic illustration depicting sub-regions of the larval zebrafish brain. E, ROIs and representative calcium traces (ΔF/F) of PTZ-induced ictal-like events; 1, 2: pallium; 3, 4: habenula; 5, 6: neuropil; 7, 8: SPV; 9, 10: cerebellum; 11, 12: hindbrain. F, Neuronal microcircuits within optic tectum and representative calcium traces of individual SPV neurons with PTZ-induced ictal-like event break-ins (underlined in red). Cerebellum was included as an indicator of ictal-like events that involve all brain regions. Scale bars as indicated in figure. |
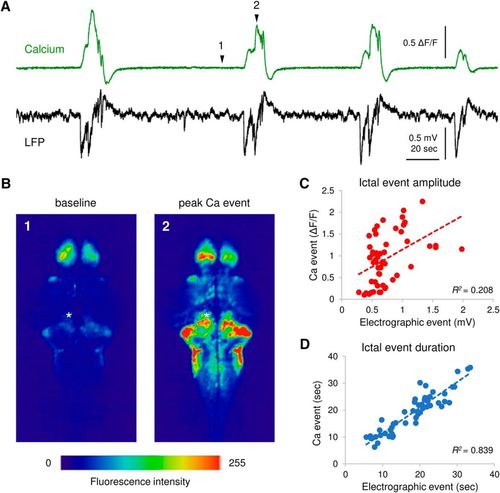
Correlation between LFP and calcium transients. A, Representative simultaneous calcium traces (green) from the cerebellum and LFP (black) recorded from optic tectum/cerebellum with recurrent PTZ-induced ictal-like seizures. Scale bars as indicated in figure. B, Fluorescence images of calcium activity during baseline and peak ictal-like event. The intensity of fluorescence is color coded as shown in the color bar. Events 1 and 2 as noted in A. Asterisk indicates the LFP recording site. C, D, Correlation between LFP and calcium transients in ictal-like event amplitude (C) and duration (D). Corresponding correlation coefficient R 2 is indicated in figure; n = 54 events from 10 PTZ-treated larvae. |

ZFIN is incorporating published figure images and captions as part of an ongoing project. Figures from some publications have not yet been curated, or are not available for display because of copyright restrictions. |
|
ZFIN is incorporating published figure images and captions as part of an ongoing project. Figures from some publications have not yet been curated, or are not available for display because of copyright restrictions. |
|
ZFIN is incorporating published figure images and captions as part of an ongoing project. Figures from some publications have not yet been curated, or are not available for display because of copyright restrictions. |
|
ZFIN is incorporating published figure images and captions as part of an ongoing project. Figures from some publications have not yet been curated, or are not available for display because of copyright restrictions. |