
Fig. S1
- ID
- ZDB-FIG-190107-19
- Publication
- Crespo et al., 2018 - Characterisation of maturation of photoreceptor cell subtypes during zebrafish retinal development
- Other Figures
- All Figure Page
- Back to All Figure Page
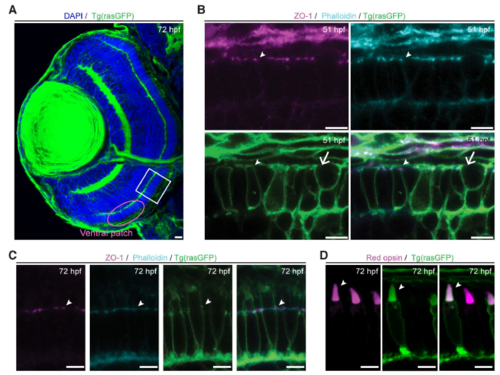
Tg(rasGFP) line as a tool to identify PRC compartments. A-D: Retinal section of zebrafish Tg(rasGFP) embryos at 72 hpf, with endogenous fluorescence of membranes marked in green. A: Confocal image of the full zebrafish eye section with DAPI in blue. The white box ventral to the optic nerve demarcates the region from which the images shown in Fig. 1 were taken, and the magenta circle demarcates the ventral patch. B: Confocal image of PRCs stained with ZO-1 (magenta) and phalloidin (cyan). Arrowheads highlight junctions and arrows point to dividing cell. C: Fluorescent structures marked by Tg(rasGFP) (green) co-localise with ZO-1 (magenta) and phalloidin (cyan) (arrowheads), thus highlighting the junction. D: Endogenous fluorescence of TgBac(opn1lw1:opn1lw1-mNeonGreen/opn1lw2:opn1lw2-mKate) (magenta) highlights the OS, which overlaps with the cone-shaped structure marked by Tg(rasGFP). Arrowhead highlights OSs. Scale bars: A: 10 µm, B-D: 5 µm. |