
Fig. 1
- ID
- ZDB-FIG-190107-13
- Publication
- Crespo et al., 2018 - Characterisation of maturation of photoreceptor cell subtypes during zebrafish retinal development
- Other Figures
- All Figure Page
- Back to All Figure Page
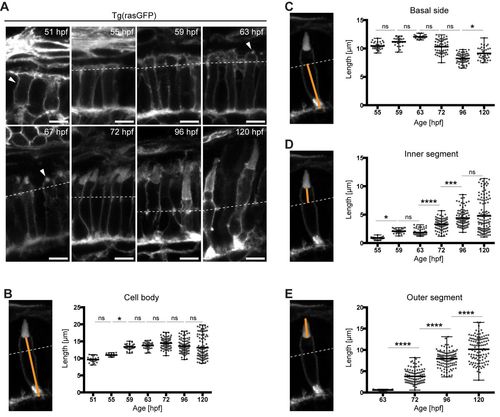
Growth of the different PRC compartments during maturation. (A) Confocal images of the PRC layer in retinal sections of Tg(rasGFP) embryos, with plasma membrane in grey at various timepoints. hpf: hours post fertilisation. Dashed lines mark the level of the outer limiting membrane, OLM. At 51 hpf, the arrowhead outlines a PRC precursor and at 63–67 hpf an emerging outer segment (OS). Scale bars: 5 µm. (B–E) Confocal images of individual PRCs from retinal sections of Tg(rasGFP) animals at 72 hpf. The orange lines mark the compartment measured. The quantification of the length of different PRC compartments at different developmental times are shown adjacent to each image. Length of cell body (B), basal side (C), inner segment (D) and outer segment (E) are represented in dot plots with calculated minimum, mean, and maximum. On average, 70 cells from a total of 4–6 independent embryos were quantified per timepoint. Statistical significance was calculated by a one-way ANOVA followed by Tukey's multiple comparison test. The significance is as follows: ns (non-significant)=P>0.05, *=P≤0.05, **=P≤ 0.01, ***=P≤0.001, ****=P≤0.0001. |