
Fig. 4
- ID
- ZDB-FIG-190107-16
- Publication
- Crespo et al., 2018 - Characterisation of maturation of photoreceptor cell subtypes during zebrafish retinal development
- Other Figures
- All Figure Page
- Back to All Figure Page
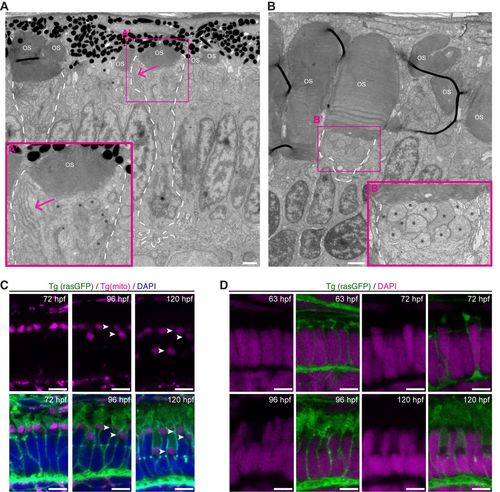
Organelles show different positioning during PRC maturation. (A) Electron micrograph of a section through the PRC layer of a wild-type zebrafish embryo at 72 hpf. (A′) Blow-up of the box indicated in A, showing Endoplasmic reticulum (ER) clusters (arrow) in the ellipsoid region of rod-like PRCs. (B) Electron micrograph of a section through the PRC layer in the ventral patch, a rod enriched region, of a wild-type zebrafish embryo at 120 hpf. (B′) Blow-up of the box indicated in B, showing mitochondria accumulate in the inner segment (arrow). ER clusters are no longer visible. For both A and B, asterisks mark the mitochondria, ‘OS’ the OSs, and PRCs with large OS are outlined with a dashed line. (C) Confocal images of retinal sections of zebrafish embryos at 72 hpf, 96 hpf and 120 hpf. Endogenous fluorescence of Tg(mito:GFP) (magenta) and Tg(rasGFP) (green). DAPI staining (nuclei) in blue. Arrowheads point to mitochondria. Note that mitochondria can be found in three distinct layers by 120 hpf. (D) Confocal images of retinal sections of zebrafish embryos at 63 hpf, 72 hpf, 96 hpf and 120 hpf. Endogenous fluorescence of Tg(rasGFP) (green) DAPI staining in magenta. Scale bars: A–B: 1 µm, C–D: 5 µm. |