
Fig. 3
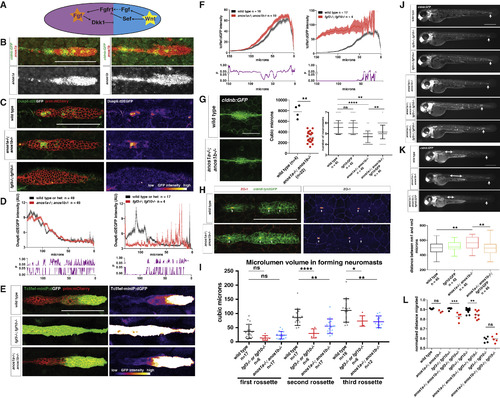
Anos1 Enhances FGF Signaling in the Primordium (A) Schematic of the cross-repression between Wnt and FGF signaling in the primordium. (B) Top, anos1a and anos1b mRNA expression in the primordium outlined by membrane GFP. Bottom, anos1a and anos1b mRNA expression only (white). Scale bar represents 100 μm. (C) dusp6:d2eGFP expression in the primordium and dusp6:d2eGFP expression only (fire heatmap) for the genotypes indicated. Scale bar represents 100 μm. (D) Top, quantification of GFP intensity from dusp6:d2EGFP inside the primordium along the anterior-posterior axis. X axis represents distance from the front of the primordium. Mean and SEM are shown. n indicates number of embryos. Bottom, plot of p values comparing the two genotypes in the graph above for each position along the x axis. (E) Wnt reporter readout at 36 hpf in the primordium on the left and Wnt reporter readout only (fire heatmap below). Scale bar represents 100 μm. (F) Quantification of Wnt reporter intensity. X axis represents distance from the front of the primordium. Mean and SEM and are shown. n = number of individual embryos measured. (G) Neuromast size and number defects in anos1 mutants. Neuromast 1 in embryos of the indicated genotype at 32 hpf (left). Scale bar represents 50 μm. Quantification of neuromast 1 volume in embryos of indicated genotype at 32 hpf (middle). Neuromast number in 42-hpf embryos of indicated genotype (right). Mean, SD, and individual data points are shown. n.s.= p > 0.05, ∗∗ = p < 0.01., and ∗∗∗∗ = p < 0.0001. ANOVA p < 0.0001. (H) (Left) ZO-1 and GFP immunostaining in the primordium of embryos of the indicated genotype at 36 hpf. (Right) ZO-1 only (fire look-up table). Arrows indicate ZO-1 signal at the center of apical constrictions. Scale bar represents 100 μm. (I) Quantification of microlumen volumes in forming neuromasts in embryos of indicated genotypes. Mean, SD, and individual data points are shown. n.s. = p > or = 0.05, ∗ = p < 0.05., ∗∗ = p < 0.01. and ∗∗∗∗ = p < 0.0001. ANOVA p < 0.0001. (J) Phenotype of embryos with reduced FGF signaling with or without mutations in anos1a and anos1b at 50 hpf. The arrow indicates the position of the primordium. Scale bar represents 500 μm. (K) Primordium and neuromast position in embryos of indicated genotypes at 50 hpf (left). The arrow denotes the position of the primordium. The double-headed arrow indicates spacing between neuromast 1 and 2. Scale bar represents 500 μm. Box and whisker plot of the distance between neuromast 1 and 2 for the genotypes indicated (right). n is the number of individual embryos. ns = p >0.05, ∗∗ = p < 0.01. ANOVA p < 0.01. (L) Quantification of normalized distance migrated for the genotypes indicated. Mean, SD, and individual data points are shown. n.s. = p > 0.05, ∗∗ = p < 0.01, ∗∗∗ = p < 0.001. ANOVA p < 0.0001. See also Figure S3. |
Reprinted from Developmental Cell, 46(6), Wang, J., Yin, Y., Lau, S., Sankaran, J., Rothenberg, E., Wohland, T., Meier-Schellersheim, M., Knaut, H., Anosmin1 Shuttles Fgf to Facilitate Its Diffusion, Increase Its Local Concentration, and Induce Sensory Organs, 751-766.e12, Copyright (2018) with permission from Elsevier. Full text @ Dev. Cell