
Fig. 6
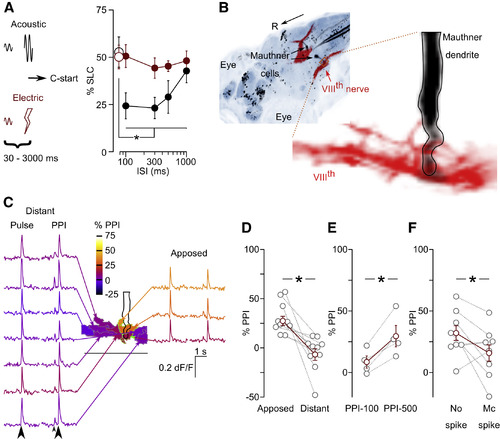
Presynaptic Inhibition Mediates Long-Interstimulus Interval Prepulse Inhibition (A) Startle responsiveness (% SLC) to an acoustic pulse (black) or an electric field pulse (red) at intervals of 100 to 1,000 ms after an acoustic prepulse. n = 9 groups of 20 larvae. Error bars are SEM. ∗Paired t test, p < 0.05. (B) Projection showing the auditory ganglia (y256-Gal4, red) and Mauthner cells (y264-Gal4, black). Right: auditory nerve expressing iGluSnFR (y256-Gal4, UAS:iGluSnFR, red) and the Mauthner lateral dendrite (black). (C) Mean iGLuSnFR signals of VIIIth nerve clusters (color-coded) in response to pulse alone (left traces) and PPI trials (right traces). Arrowheads: time of a prepulse (small) and pulse (large). Black outline: Mauthner lateral dendrite. Scale bar, 50 μm. (D) PPI of iGluSnFR signal in VIIIth nerve segments adjacent to the Mauthner dendrite (Apposed), or not (Distant). n = 10 larvae. ∗WSR test, p = 0.002. Red in (D)–(F) is mean ± SEM. (E) iGluSnFR PPI for apposed segments at 100 and 500 ms interstimulus interval (ISI) PPI tests. n = 4 larvae. ∗WSR test, p = 0.02. (F) iGluSnFR PPI for apposed segments when Mauthner action potential was suppressed (No spike) or present (Mc spike). n = 9 larvae. ∗WSR test, p = 0.04. See also Figure S6. |