
Fig. 5
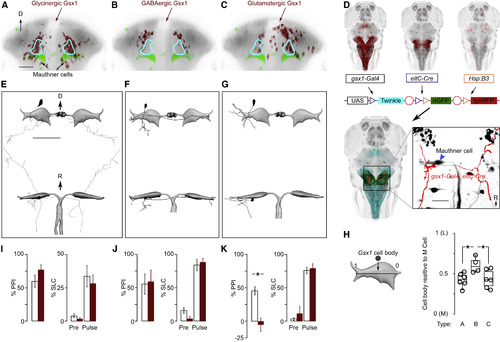
Glutamatergic Gsx1 Neurons in the PPI-Active Zone Project to the Mauthner Lateral Dendrite and Are Required for Prepulse Inhibition (A–C) Coronal view of glycinergic Gsx1 neurons (A, gsx1:Cre, glyt2:Switch-Gal4, UAS:GFP, red), GABAergic Gsx1 neurons (B, gsx1-Gal4, UAS:Cre-ERT2, gad1b:Switch-GFP, red), and glutamatergic Gsx1 neurons (C, gsx1:Cre, vglut2a:Switch-Gal4, UAS:GFP, red) in R4. Cyan border outlines the PPI-active zone. Green: Mauthner cells. Dorsal (D); all scale bars, 50 μm. (D) Schematic of the DoubleSwitch method where heat-shock-controlled expression of B3 is used to stochastically remove the stop cassette in a UAS:DoubleSwitch reporter, leading to RFP expression in neurons that also express Cre and Gal4. Inset: reconstruction of an isolated Gsx1 neuron (red) and retrograde labeling of ipsilateral Mauthner cell (black, blue arrowhead). Rostral (R). (E–G) Reconstructions of morphological subtypes of Gsx1 neuron in the PPI-active region (E, type A, n = 8 ; F, type B, n = 5 ; G, type C, n = 5) with a standard model of Mauthner cells in coronal (top) and horizontal (bottom) views. (H) Relative positions of type A (n = 6 neurons), B (n = 4 neurons), and C (n = 6 neurons) cell bodies along the medial-lateral axis of the ipsilateral Mauthner cell. Box plots are median and quartiles; whiskers are 10%–90%. ∗WRS test, p < 0.05. (I–K) Prepulse inhibition (% PPI) and startle responsiveness (% SLC) after ablation of glycinergic (I), GABAergic (J), or glutamatergic (K) neurons in the PPI-active region. White bars, sham ablated. Red bars, ablated. Startle trials used two stimulus intensities corresponding to the prepulse (Pre) and pulse (Pulse) in PPI trials. Number of larvae used was 9/6 (sham/ablated) in (I), 4/4 in (J), and 8/5 in (K). Error bars are SEM. ∗WRS test, p < 0.05. See also Figures S4 and S5. |