
Fig. 2
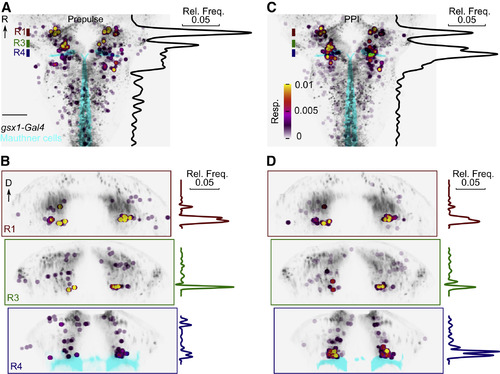
Prepulse Inhibition-Active Neurons Cluster near the Mauthner Cell (A and C) Horizontal view of neurons that respond in the 500-ms windows after a prepulse on prepulse-alone (A) or during prepulse inhibition trials (prior to presentation of the pulse-stimulus) (C). Gray: all Gsx1 neurons. Cyan: Mauthner cells. Scale bar, 50 μm. Histograms represent the relative frequency of prepulse-responsive and PPI-responsive neurons, along the rostro-caudal axis. Neurons are color coded by responsiveness (Resp.), a measure of the response probability of the neuron, normalized by total activity in all neurons on each trial type. (B and D) Coronal views of neurons that respond to a prepulse (B) or during prepulse inhibition trials (D) in rhombomere 1 (red), rhombomere 3 (green), and rhombomere 4 (blue) and the corresponding distribution of prepulse-responsive neurons along the dorsal-ventral axis. Position of each substack is indicated in corresponding horizontal views. |