
Fig. S3
- ID
- ZDB-FIG-180720-40
- Publication
- Löhr et al., 2018 - Diet-Induced Growth Is Regulated via Acquired Leptin Resistance and Engages a Pomc-Somatostatin-Growth Hormone Circuit
- Other Figures
- All Figure Page
- Back to All Figure Page
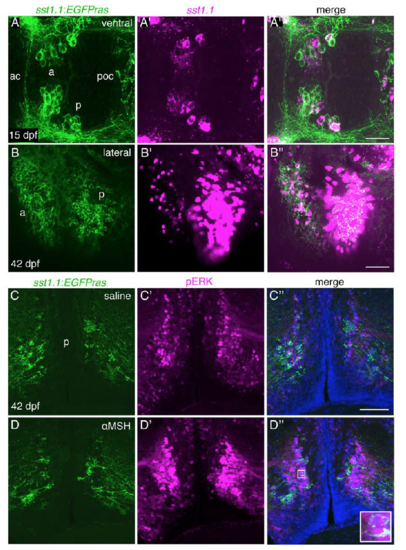
The sst1.1:EGFPras transgenic line recapitulates endogenous sst1.1 expression and reveals activation of hypophysiotropic Sst1.1 neurons after αMSH ICV injection. Related to Figures 5 and 7. (A-B’’) sst1.1 FISH (magenta) in combination with GFP IF (green) in sst1.1:EGFPras transgenic fish at 15 dpf (A-A’’) and 42 dpf (B-B’’) revealing co-localization of sst1.1 transcripts and GFP both in the anterior (a) and posterior (p) domains of the preoptic area (POA). (C-D’’) Co-IF for GFP (green) and pERK (magenta) on cross-sections (12 μm) at the level of posterior Sst1.1 POA cell clusters of tg(sst1.1:EGFPras) fish (42 dpf), 30 min after cerebroventricular injection of saline (C-C’’) or αMSH/saline (DD’’). pERK levels are strongly increased after αMSH application in a broad region of the POA including Sst1.1 neurons (see arrowheads and inset in D’’). Scale bars: (A’’): 50 μm, (B’’, C’’) 100 μm. ac: anterior commissure, poc, postoptic commissure. |