
Fig. 5
- ID
- ZDB-FIG-180720-35
- Publication
- Löhr et al., 2018 - Diet-Induced Growth Is Regulated via Acquired Leptin Resistance and Engages a Pomc-Somatostatin-Growth Hormone Circuit
- Other Figures
- All Figure Page
- Back to All Figure Page
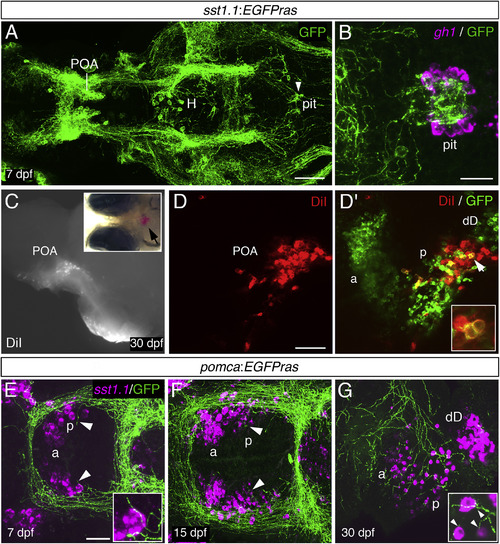
Sst1.1-Neurons of a Posterior POA Domain Project to Pituitary Somatotropes and Are Innervated by Pomca Cell Axons (A) Anti-GFP IF on an sst1.1:EGFPras transgenic larva at 7 dpf. GFP+ axons innervating the pituitary (pit) are indicated by an arrowhead. H, hypothalamus; POA, preoptic area. (B) gh1 ISH (magenta) co-stained via anti-GFP IF (green) at 7 dpf reveals extensive innervation of the gh1 domain in the adenohypophysis by GFP+ Sst1.1 axons. (C–D′) Placement of DiI crystals into the pituitary of sst1.1:EGFPras fish at 30 dpf (C) retrogradely labels cell bodies in the POA (see arrowhead in inset for position of DiI). (D and D′) Within the POA, the posterior (p), but not the anterior (a) Sst1.1-cell domain, contains DiI+ cells. (D′, inset) Magnification of the region labeled by the arrowhead. Additional Sst1.1 cells (dD) are located outside the POA. (E–G) sst1.1 ISH combined with anti-GFP IF in pomca:EGFPras transgenic at 7 dpf (E), 15 dpf (F), and 30 dpf (G) showing innervation of the posterior Sst1.1 POA domain by Pomca-cell axons at all examined stages (see arrowheads and magnifications). Scale bars represent 100 μm (A), 25 μm (B, E, and F), and 50 μm (D and G). Ventral views are shown in (A), (B), (E), and (F), and lateral views are shown in (C)–(D′) and (G). |
| Genes: | |
|---|---|
| Fish: | |
| Anatomical Terms: | |
| Stage Range: | Days 7-13 to Days 30-44 |
| Fish: | |
|---|---|
| Observed In: | |
| Stage: | Days 30-44 |