
FIGURE
Fig. S3
- ID
- ZDB-FIG-180711-58
- Publication
- Iwasaki et al., 2018 - Epidermal regulation of bone morphogenesis through the development and regeneration of osteoblasts in the zebrafish scale
- Other Figures
- All Figure Page
- Back to All Figure Page
Fig. S3
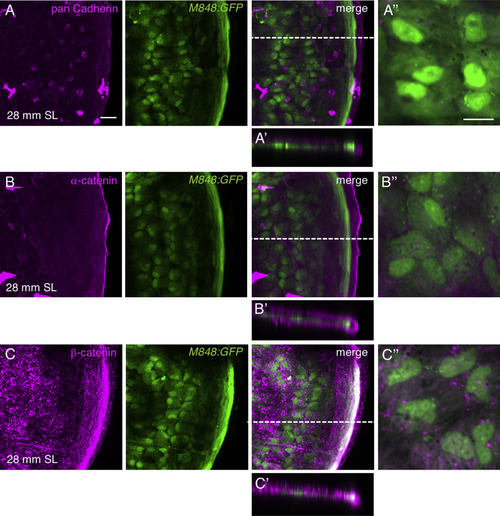
Epithelial markers are not expressed in the central osteoblasts. (A–C) Scales of M848:GFP fish were stained with antibodies against pan-cadherin (A), α-catenin (B), and β-catenin (C). None of these antibodies labeled the cell boundaries of the central osteoblasts. (A′–C′) Optical cross-sections at a thickness of 58.9 µm (A′), 55.4 µm (B′), and 65.8 µm (C′). (A″–C″) Higher magnifications for the central cells. Scale bars, 20 µm (A–C), 10 µm (A″–C″). |
Expression Data
Expression Detail
Antibody Labeling
Phenotype Data
Phenotype Detail
Acknowledgments
This image is the copyrighted work of the attributed author or publisher, and
ZFIN has permission only to display this image to its users.
Additional permissions should be obtained from the applicable author or publisher of the image.
Reprinted from Developmental Biology, 437(2), Iwasaki, M., Kuroda, J., Kawakami, K., Wada, H., Epidermal regulation of bone morphogenesis through the development and regeneration of osteoblasts in the zebrafish scale, 105-119, Copyright (2018) with permission from Elsevier. Full text @ Dev. Biol.