
Fig. 3
- ID
- ZDB-FIG-180711-50
- Publication
- Iwasaki et al., 2018 - Epidermal regulation of bone morphogenesis through the development and regeneration of osteoblasts in the zebrafish scale
- Other Figures
- All Figure Page
- Back to All Figure Page
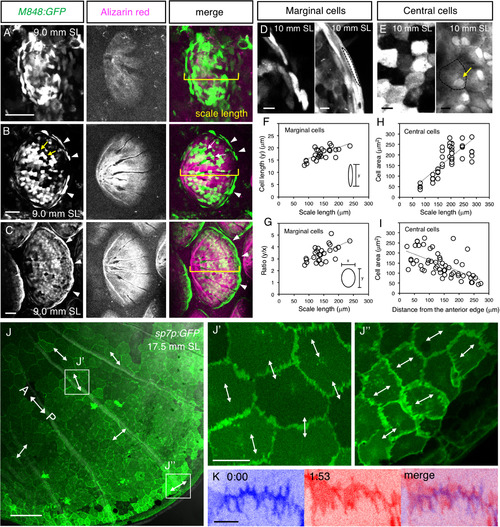
Development of central and marginal osteoblasts. (A–C) Scales of the M848:GFP fish were labeled with Alizarin red. GFP starts to be expressed in a loose condensation of irregularly shaped cells (A). Then, the central cells (arrows) and marginal cells (arrowheads) become apparent (B). Eventually, the central cells form a monolayer along the inner surface of the scale matrix, whereas the marginal cells become elongated along the scale edge (C). (D–I) Morphological changes in marginal (D,F,G) and central (E,H,I) cells during development. The cells are outlined by the dotted lines (D,E). The marginal cells become elongated as scales grow (D,F,G). The size of the central cells increases (E,H) and their nuclei become located at cell–cell boundaries (arrow in (E)). The central cells are larger in the anterior region of the scales (I; see also (J)). (J,K) Membrane dynamics of central cells in the sp7p:GFP-caax fish. The cell boundaries harbor parallel processes comprising zigzag lines (J). The transmitted light image is superimposed in (J) to visualize radii. The processes are aligned parallel to the anteroposterior (AP) axis (A↔ P) in the anterior region (J′, higher magnification) and perpendicular to the AP axis in the posterior region (J″); the orientations of processes are shown by the double-headed arrows. The processes are moving dynamically over time (K). Two images at different time points are superimposed (blue and magenta). See Supplemental Movie S1 for the time-lapse recording. The standard length (SL) of each fish is indicated. Scale bars, 50 µm (A–C), 10 µm (D,E), 100 µm (J), 20 µm (J′,J″), 5 µm (K). |
Reprinted from Developmental Biology, 437(2), Iwasaki, M., Kuroda, J., Kawakami, K., Wada, H., Epidermal regulation of bone morphogenesis through the development and regeneration of osteoblasts in the zebrafish scale, 105-119, Copyright (2018) with permission from Elsevier. Full text @ Dev. Biol.