
Fig. 2
- ID
- ZDB-FIG-180711-49
- Publication
- Iwasaki et al., 2018 - Epidermal regulation of bone morphogenesis through the development and regeneration of osteoblasts in the zebrafish scale
- Other Figures
- All Figure Page
- Back to All Figure Page
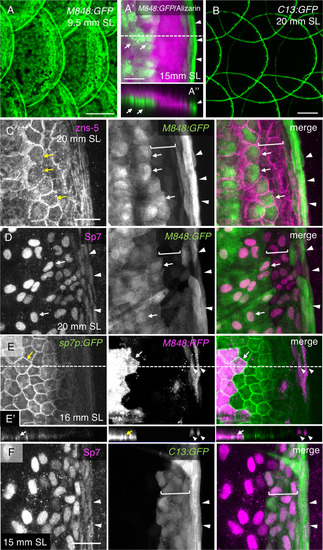
Three distinct populations of osteoblasts visualized using M848:GFP and C13:GFP. (A,B) Expression of green fluorescent protein (GFP) in scales of the gSAIzGFFM848A:gal4;UAS:GFP (M848:GFP) fish (A) and hspGFFDMC13F:gal4;UAS:GFP (C13:GFP) fish (B). (A′) Higher-magnification of the posterior regions of a scale from M848:GFP fish stained with Alizarin red. (A″) Optical cross section along the dashed line in (A′) at a thickness of 31.2 µm. M848:GFP is expressed in the cells located along the inner surface of the scale (arrows), and along the scale edge (arrowhead). (C,D) Posterior regions of scales of the M848:GFP fish labeled with antibodies against the osteoblast markers zns-5 (C) and Sp7 (D). Two different populations of osteoblasts are labeled with M848:GFP: central cells (arrows), and marginal cells (arrowheads). In addition, there are two or three rows of M848:GFP-negative submarginal cells between these two populations (brackets). Expression of Sp7 is weaker in marginal cells (arrowheads in (D)). (E) Scale of the triple-transgenic line M848:gal4;UAS:RFP;sp7p:GFP-caax, in which red fluorescent protein (RFP) is mosaically expressed. GFP is strongly expressed in central cells (arrows) compared with marginal cells (arrowheads). (E′) Optical cross-section along the dashed line in (E) at a thickness of 15.2 µm. M848:RFP labels central cells (arrow) and marginal cells (arrowheads). (F) Posterior regions of scales of the C13:GFP fish labeled with anti-Sp7 antibody. C13:GFP is expressed in marginal cells (arrowheads) and submarginal cells (brackets). See Fig. 1C for the schematic representation of the osteoblast subtypes. The standard length (SL) of each fish is indicated. Scale bars, 100 µm (A,B), 20 µm (A′, C–F). |
Reprinted from Developmental Biology, 437(2), Iwasaki, M., Kuroda, J., Kawakami, K., Wada, H., Epidermal regulation of bone morphogenesis through the development and regeneration of osteoblasts in the zebrafish scale, 105-119, Copyright (2018) with permission from Elsevier. Full text @ Dev. Biol.