
Fig. S2
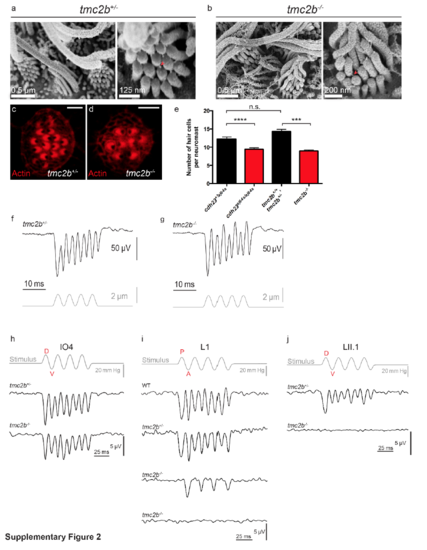
Consequences of the tmc2b mutation on hair bundle morphology, hair cell presence, and ear and neuromast function. (a) Scanning electron micrograph of hair bundles of heterozygous animals with stereocilia (shorter, thinner) and kinocilia (longer, thicker). The stereocilia are linked at their tips by tip link filaments (red arrow head). (b) In the tmc2b-/- mutant, the hair bundle is morphologically normal at the ultrastructural level. Confocal micrographs of the L2 neuromasts of heterozygous (c) and tmc2b-/- mutant (d) zebrafish labeled with phalloidin (red) at 7 dpf. Planer cell polarity is normal in the mutant. Scale bar = 2.5 μm. (e) Mean hair cell numbers ± SEM in posterior neuromasts in tmc2b-/-, cdh23aj64a/aj64a, and controls of 6-dpf zebrafish. cdh23+/aj64a = 12.3 ± 0.6 (n = 32); cdh23aj64a/aj64a = 9.5 ± 0.4 (n = 39); tmc2b+/+, tmc2b+/- = 14.4 ± 0.6 (n = 31); tmc2b-/- = 9.0 ± 0.3 (n = 45). **** equal to P value < 0.0001 and *** represents P = 0.0067, Kruskal-Wallis analysis with a Dunn’s multi-comparison test. Representative extracellular recordings of microphonic potentials measured from ears (f,g) and neuromasts (h,i,j) are displayed (for comparison i is the same as in Fig. 3a). Ears from controls (67.95 ± 9.52 μV, n = 8) and mutant (69.3 ± 7.86 μV, n = 6) larvae at 8-9 dpf have robust responses at twice the stimulus frequency (P = 0.8518, Mann-Whitney test). Microphonic potentials from neuromast IO4 were not impacted by the tmc2b mutation. The responses of posterior A-P and D-V oriented neuromasts are most frequently absent (9 of 15 for A-P oriented and 6 of 6 for D-V oriented neuromasts); however, in some cases in A-P oriented, 6 of 15, responses were highly asymmetric, with a weakened amplitude for one direction of stimulus and no response for the other direction. Therefore, the 2f response became a 1f response. Red letters represent deflection dorsally (D), ventrally (V), anteriorly (A), and posteriorly (P). |