
Fig. 6
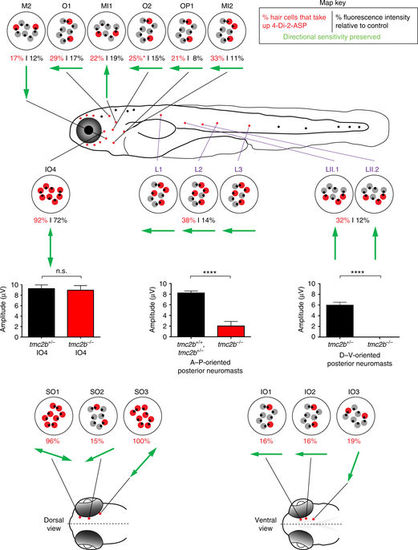
A mechanosensory map of Tmc2b dependence in the anterior and posterior lateral lines. In this graphic of a larval zebrafish tmc2b −/− mutant, red neuromasts have been characterized. Individual neuromasts with patterns of FM1-43FX uptake are displayed. Red hair cells take up FM1-43FX; gray hair cells do not. Below each schematized neuromast is the percentage of hair cells that load 4-Di-2-ASP (red text) in the tmc2b −/− mutant and the percentage of fluorescence intensity of hair cells of the mutant relative to hair cells of wild-type and heterozygous animals (black). Green arrows represent the directional sensitivity preserved in the mutant based on FM1-43FX uptake. Graphs of mean microphonic potentials from neuromasts directly above each plot are displayed. For IO4, tmc2b +/− = 9.2 ± 0.7 μV (n = 9), and tmc2b −/− = 8.9 ± 0.87 μV (n = 6). P value = 0.9546. For A–P oriented posterior neuromasts, tmc2b +/+, tmc2b +/− = 8.3 ± 0.37 μV (n = 20), and tmc2b −/− = 2.1 ± 0.8 μV (n = 15). ****P value < 0.0001. For D–V oriented posterior neuromasts, tmc2b +/− = 6 ± 0.49 μV (n = 4) and tmc2b −/− = 0 ± 0 μV (n = 6). ****P value = 0.0048. P values were obtained from the Mann–Whitney test. For 4-Di-2-ASP uptake assays of SO and IO neuromasts, n ≥ 5. n values for other neuromasts are listed in Figs. 3, 4 legends |