
Fig. 5
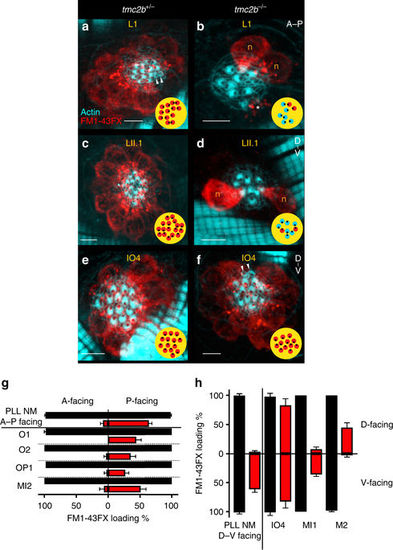
Hair cell PCP and neuromast position govern dependence of mechanotransduction channel function on Tmc2b. a–f Confocal images of hair cells from L1, LII.1, and IO4 neuromasts of tmc2b +/− or tmc2b −/− animals. FM1-43FX (red) uptake reveals functional channels, and phalloidin (cyan) shows hair bundle polarity. Qualitative maps (yellow) of micrographs from tmc2b −/− mutants show that subpopulations of posterior- and ventral-facing hair bundles preferentially function (red) in L1 and LII.1, respectively; in contrast, hair cell uptake in IO4 is non-biased. g In PLL neuromasts with A–P orientations of tmc2b −/− mutants, the vast majority (n = 21) of FM1-43FX uptake is by hair bundles that are posterior facing (P-facing). Similarly, in the A–P-oriented neuromasts of the ALL of tmc2b −/− (O1, O2, OP1, and MI2), the overwhelming majority of FM1-43FX uptake is by P-facing hair cells (n ≥ 5, except for O1, n = 4). Red bars represent tmc2b −/−, and black bars signify tmc2b +/+ and tmc2b +/−. h In the PLL neuromasts with D–V orientations of tmc2b −/− mutants, ventral-facing (V-facing) hair cells dominate the population that uptakes the fluorophore (n = 16). In ALL neuromasts with D–V orientations of tmc2b −/−, the patterns of hair cells that take up FM1-43FX are complex. For IO4, there is no significant difference between the numbers of D- and V-facing hair cells that loaded with FM1-43FX. The FM1-43FX loading percentages are 82.6 ± 11.1 % (n = 5) for V-facing hair cells and 83.0 ± 11.1 % (n = 5) for D-facing hair cells in tmc2b −/−, respectively. One-way ANOVA with Holm-Sidak’s multiple comparisons test, P = 0.9986. D–V-oriented neuromasts MI1 and M2 have opposite PCP-related loading preferences in mutants. In MI1 and M2 of tmc2b −/− animals, the percentages of V-facing hair cells that load with FM1-43FX are 36.1 ± 3.4% (n = 6) and 2.9 ± 2.9% (n = 5), respectively. Whereas, the percentages of D-facing hair cells from MI1 and M2 that load with FM1-43FX are 7.9 ± 3.6% (n = 6) and 44.9 ± 8.3% (n = 5), respectively (see Supplementary Table 1 for statistics). Corresponding images of MI1 and M2 displayed in Supplementary Fig. 7. Scale bar = 5 μm. Arrowheads, immature hair cells that do not take up FM1-43FX. *dying hair cell |