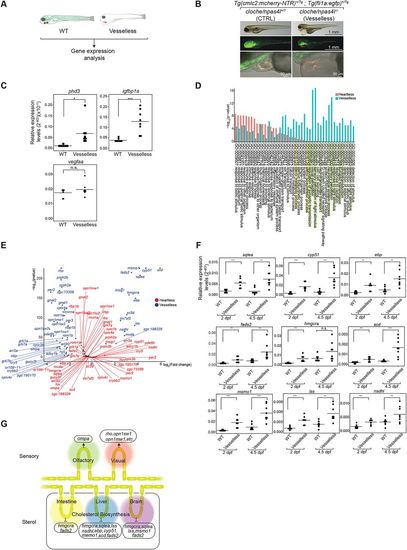
Characterization of ‘vesselless’. (A). Schematic description of the ‘vesselless’ model and the experimental strategy. Green, vECs, endocardium and hematopoietic cells; red, cardiomyocytes. (B). Specific absence of hematovascular cells (i.e. vECs, endocardium, hematopoietic cells) in ‘vesselless’. Green, vECs and endocardium; red, cardiomyocytes. Scale bars: 1 mm (top); 1 mm (middle); 50 µm (bottom). (C). qRT-PCR analysis of pan-hypoxia indicator genes in ‘vesselless’. *P<0.05; ***P<0.001; n.s., not significant. Student’s t-test. n=8 (WT siblings), 8 (‘vesselless’). (D). GO enrichment analysis of ‘vesselless’ (blue) and ‘heartless’ (red). The top 44 GO terms are shown. Highlighted are neural/sensory (green) and sterol (yellow)-related GOs. (E). Volcano plot representing differentially expressed genes in ‘vesselless’. Shown are genes that are specifically affected in ‘heartless’ (red) and in ‘vesselless’ (blue). n=2. (F). qRT-PCR analysis of cholesterol biosynthesis genes. **P<0.01; ***P<0.001. n.s., not significant. Student’s t-test. n=8 (WT siblings), 7 (‘vesselless’ at 2 dpf), 8 (‘vesselless’ at 4.5 dpf). (G). Summary of differentially expressed genes in ‘vesselless’.
|
