|
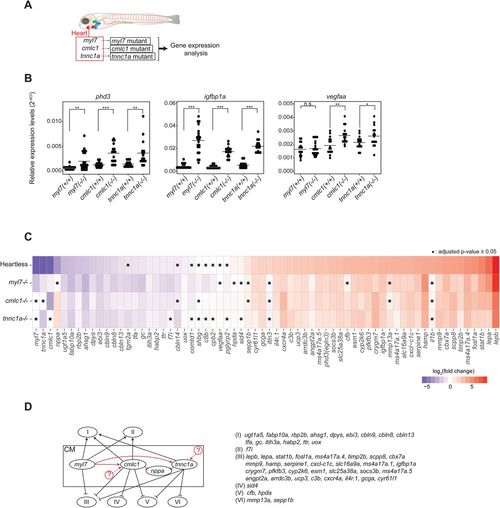
Characterization of cardiomyocyte-specific gene mutants. (A). Schematic description of the cardiomyocyte-specific gene mutant models and the experimental strategy. (B). qRT-PCR analysis of pan-hypoxia indicator genes in each mutant. *P<0.05; **P<0.01; ***P<0.001; n.s., not significant. Student’s t-test. n=16 (WT siblings), 22 (myl7−/−), 16 (cmlc1−/−), 16 (tnnc1a−/−). (C). Heatmap representing the expression patterns of each gene in each mutant. ▪P≥0.05, Student’s t-test followed by Benjamini-Hochberg procedure to correct errors for the multiple tests. n=16-22. (D). Genetic interactions among mutants. See the text for the detailed description of each category. Black arrows and lines indicate interactions between cardiomyocytes and noncardiac organs. Red arrows and lines indicate intracardiac interactions. The possibility of yet unidentified upstream regulators of cmlc1 and/or tnnc1a is indicated by circled question marks.
|