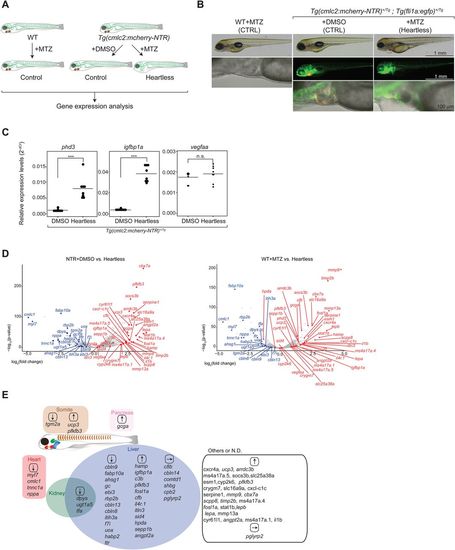
Characterization of ‘heartless’. (A). Schematic description of the ‘heartless’ model and the experimental strategy. (B). Specific absence of cardiomyocytes in ‘heartless’. Scale bars: 1 mm (top); 1 mm (middle); 100 µm (bottom). Red, cardiomyocytes; green, vECs and endocardium. Bright-field/DIC images are shown for WT-MTZ as they do not carry a fluorescent reporter. (C). qRT-PCR analysis of pan-hypoxia indicator genes in ‘heartless’. ***P<0.001; n.s., not significant. n=8 for both Tg(cmlc2:mcherry-NTR)+DMSO and ‘heartless’. (D). Volcano plot representing the differentially expressed genes in ‘heartless’, as compared to Tg(cmlc2:mcherry-NTR)+DMSO (NTR+DMSO) (left) and WT+MTZ (right). n=2. Up- and downregulated genes (as also confirmed by qRT-PCR, see Table S1) are highlighted in red and blue, respectively. (E). Organ-specific expression patterns of differentially expressed genes in ‘heartless’. They are placed in each organ. Up- and downregulated genes are indicated by ↑and ↓, respectively. Some of the genes unaffected in ‘heartless’ are also included and indicated by →. Many of the liver-specific genes were also confirmed by whole-body transcriptome analysis of the liver-ablated larvae (‘liverless’) (Fig. S3).
|
