
Fig. 6
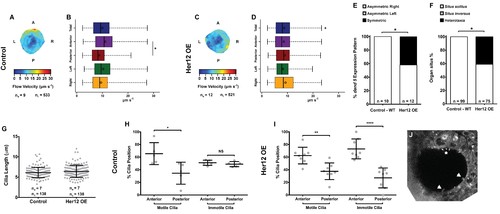
Overexpression of her12 impacts on fluid flow dynamics, dand5 expression pattern and organ situs. Fluid flow pattern and intensity found in Control (A–B) and in Her12 OE (C–D) embryos. (A, C) Heat maps of flow speed showing detailed regions within the KV for pooled embryos in Control (A) and Her12 OE (C). The pseudo-colour scale represents flow speed in μm s−1, where red represents high speed versus low speed in blue. ne – number of embryos; ntracks – number of tracks followed. (B, D) Box plots for instantaneous flow speed measured at different locations of the KVs, based on the same data set used to generate the heat maps, in Control (B) and Her12 OE (D). Box plots display the median with a vertical line, and the whiskers represent the minimum and maximum values observed. Means are represented as small circles. *p<0.05, Wilcoxon test. (E) Percentages of dand5 expression pattern at 8 ss, as determined by in situ hybridization in the same embryos used to study the fluid flow, in Control and Her12 OE. (F) Organ situs determined by observing the heart position at 30hpf, and the liver and pancreas positions at 53 hpf, by in situ hybridization with a probe for foxa3, in Control and Her12 OE. Situs solitus stands for left heart and liver; Situs inversus stands for right heart and liver; Heterotaxia stands for any other possible combination for the heart and liver position. *p<0.05, Fisher's Exact Test. (G) KV cilia length from 8 somite stage embryos in Control (7 embryos, 138 cilia) and Her12 OE (7 embryos, 138 cilia). The cilia were measured in 3D in fixed samples. (H–I) Immotile and motile cilia distribution along the Anterior – Posterior axis in Control (5 embryos) (H) and Her12 OE (9 embryos) (I) 8 somite stage embryos. Unpaired t-test with Welsh’s correction; *p<0.05 **p<0.01 and ****p<0.0001. (J) Depicts a KV slice where motile (white arrows) and immotile cilia can be observed (white asterisk). |