
Fig. 3
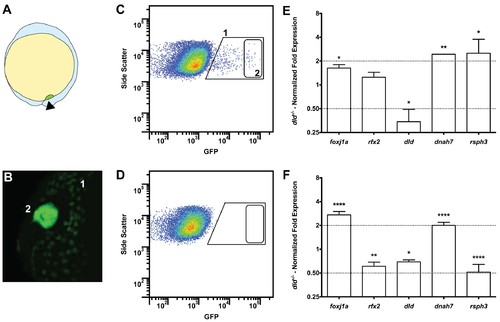
Tissue specific microarray identifies motility genes differentially expressed in dld−/− mutants. (A) Representation of a zebrafish embryo at Bud stage (10 hpf). The arrowhead shows the tail bud. In green are represented the DFCs. (B) At bud stage, sox17:GFP zebrafish Tg line, the DFCs strongly express GFP (2). At this same stage, endoderm cells also express GFP but at significantly lower levels (1). (C) FACS profiles for sox17:GFP (AB and dld−/−) Tg lines and (D) WT line without GFP for assessing embryo auto-fluorescence. In (C) the cells contained in (1) correspond to the endoderm cells, and the cells contained in (2) correspond to the DFCs. (E) Normalized fold expression (log2) of several motility related genes in dld−/− mutant embryos as determined in the microarray. t-test; *p<0.05, **p<0.01. (F) qPCR validation in normalized fold expression (log2) of the microarray results in the cells selected by FACS as in (C). Welsh t-test or the Mann–Whitney U-test; *p<0.05, **p<0.01, ****p<0.0001. |