
Fig. 4 S1
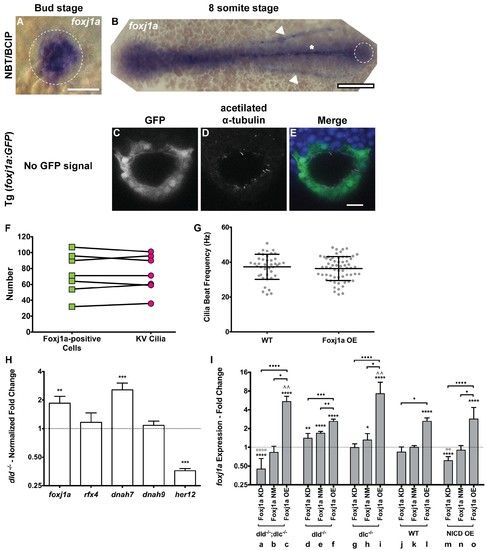
foxj1a expression analysis and loss and gain of function assays. (A–B) In situ hybridization with foxj1a riboprobe; (A) at bud stage showing the labelled purple dorsal forerunner cells; (B) later at 8 somite-stage showing the purple staining is absent from the KV cells (dotted circle) but is visible in the neural tube (asterisk) and in both pronephros (arrow heads). (C–E) Still from Video 3 representing the immuno-staining of a KV from the transgenic line Foxj1a:GFP. foxj1a-positive KV cells in green (anti-GFP antibody) (C), and KV cilia in magenta (anti-acetylated α-tubulin antibody) (D). (E) Nuclei stained with DAPI. Anterior is to the top and Left is to left. Scale bar represents 20 μm. (F) Relation between the number of foxj1a-positive cells (green ■) and the number of cilia (magenta ●) in zebrafish embryos at 8 ss. Averages were not significantly different (p=0.9479, paired t-test; 8 embryos, 514 cells, 513 cilia). (G) Cilia Beat Frequency (CBF) in WT (37.27 ± 7.202 Hz, 8 embryos, 41 cilia), and in Foxj1a OE (36.30 ± 6.877 Hz, 12 embryos, 61 cilia). p=0.4990, unpaired t-test with Welsh’s correction (averages not significantly different). (H) Transcription levels of several genes in whole zebrafish embryos. Normalized fold change (log2) in expression levels of foxj1a, rfx4, dnah7, dnah9, and her12 in whole embryos at bud stage from the dld−/− mutant. Unpaired t-test with Welsh’s correction; **p<0.01 and ***p<0.001. (I) Transcription levels for foxj1a. Fold change (log2) in expression levels of foxj1a in whole embryos with different Notch Signalling and Foxj1a manipulations at bud stage (a – o). dld−/−;dlc−/− – deltaD and deltaC double mutant; dld−/− – deltaD mutant; dlc−/− – deltaC mutant; WT – Wild Type, non-injected controls; NICD OE – overexpression of Notch Intracellular Domain by injecting NICD mRNA; Foxj1a KD – knock-down of foxj1a by Morpholino injection; Foxj1a NM – Foxj1a no-manipulation; Foxj1a OE – overexpression of Foxj1a by injecting foxj1a mRNA. Statistical significance tested with Mann-Whitney U-test (*p<0.05, **p<0.01, and ****p<0.0001). Kruscal-Wallis one-way analysis of variance with Dunn’s correction for multiple comparisons was used to determine significant differences between different Foxj1a treatments in the same NS assay (*p<0.05,**p<0.01, ***p<0.0001, and ****p<0.0001), and to determine significant differences between different NS treatments in the same Foxj1a assay (Foxj1a KD – **p<0.01, and ****p<0.0001. Foxj1a OE – **p<0.01). |