
Fig. 1
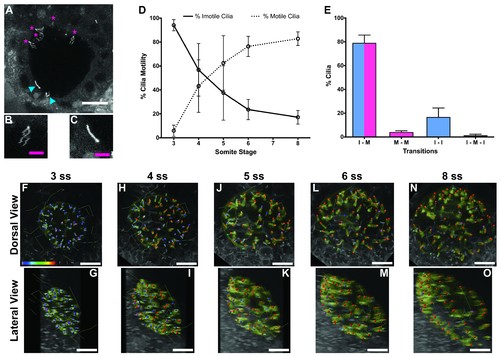
Immotile cilia are specified early in development. (A) Still from Video 1 representing a wild-type embryo injected with 400 pg Arl13b-GFP at 1 cell stage. Anterior is up and Left is left. Blue arrowheads indicate – Immotile cilia; Magenta stars indicate Motile Cilia. Scale bar represents 20 μm. (B–C) Details of a Motile (B) and Immotile Cilia (C). Scale bar (magenta) represents 5 μm. (D) Changes in the % of Motile and Immotile Cilia in KV during zebrafish development from 3 to 8 somites stage (ne = 5, nc = 294). (E) Types of cilia motility behaviours found during the Time Lapse experiment (from 3 to 8 somites stage). I – M is ‘Immotile to Motile’, M – M is ‘Always Motile’, I – I is ‘Always Immotile’, and I – M – I is ‘Immotile to Motile to Immotile’ (ne = 4, nc = 231). (F–O) Stills from Video 2, the time-lapse video obtained from a Control embryo injected with 400 pg Arl13b-GFP at 1 cell stage. Dorsal view – Anterior is to the top and Left is to left (F, H, J, L, N). Lateral view – Anterior is to the top and Dorsal is to left (G, I, K, M, O). Motile cilia (red), Immotile Cilia (blue), cilia that were always motile (from 3 to 8 ss – purple), cilia that remain always immotile (from 3 to 8 ss – cyan). In all images, scale bar represents 20 μm. ne – number of embryos and nc – number of cilia. |