
Fig. S2
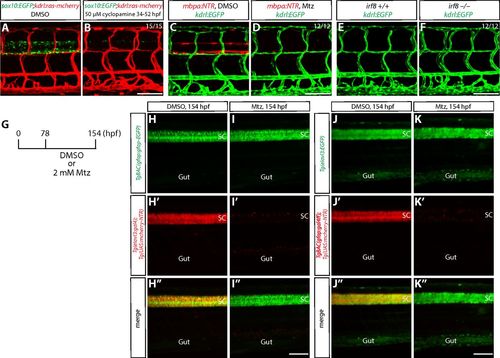
Ablation of oligodendrocytes, oligodendrocyte precursor cells, or microglia does not lead to a loss of VTAs; specificity of radial glia and neuronal ablation by the NTR/Mtz-mediated cell ablation method. (A and B) 178 hpf Tg(sox10:EGFP);Tg(kdrl:ras-mcherry) trunk after treatment with DMSO (A) or 50 µM cyclopamine (B) from 34 to 52 hpf. The loss of VTA phenotype observed after radial glia ablation is not seen in fish treated with cyclopamine, which show a dramatically reduced number of spinal cord oligodendrocytes and oligodendrocyte precursor cells (B). (C and D) 178 hpf Tg(mbpa:NTR);Tg(kdrl:EGFP) larval trunk after treatment with DMSO (C) or Mtz (D) from 78 to 178 hpf. Genetic ablation of oligodendrocytes does not lead to a loss of VTAs (D). (E and F) 178 hpf Tg(kdrl:EGFP) irf8+/+ (E) and irf8−/− (F) trunk vasculature. The loss of VTA phenotype observed after radial glia ablation is not seen in irf8−/− fish (F). (G) Experimental time course of NTR/Mtz-mediated cell ablation for H–K″. (H–H″ and I–I″) 154 hpf TgBAC(gfap:gfap-EGFP);Tg(elavl3:gal4);Tg(UAS:mcherry-NTR) trunk after treatment with DMSO (H–H″) or Mtz (I–I″) starting at 78 hpf. Mtz-treated fish show a dramatic reduction of Tg(elavl3:gal4);Tg(UAS:mCherry-NTR) expression in their spinal cord (I′), however TgBAC(gfap:Gfap-EGFP) expression appears unaffected (I) compared with DMSO-treated fish (H). (J–J″ and K–K″) 154 hpf Tg(elavl3:EGFP);TgBAC(gfap:gal4ff);Tg(UAS:mcherry-NTR) trunk after treatment with DMSO (J–J″) or Mtz (K–K″) starting at 78 hpf. Mtz-treated fish show a dramatic reduction of TgBAC(gfap:gal4ff);Tg(UAS:mCherry-NTR) expression in their spinal cord (K′). In contrast, Tg(elavl3:EGFP) expression is slightly, but not dramatically, reduced (K) compared with DMSO-treated fish that show strong expression of both TgBAC(gfap:gal4ff);Tg(UAS:mCherry-NTR) and Tg(elavl3:EGFP) expression in their spinal cord (J–J″). (Scale bar, 100 µm.) |