
FIGURE
Fig. 6
- ID
- ZDB-FIG-180119-11
- Publication
- Chen et al., 2017 - Label-free photoacoustic imaging of the cardio-cerebrovascular development in the embryonic zebrafish
- Other Figures
- All Figure Page
- Back to All Figure Page
Fig. 6
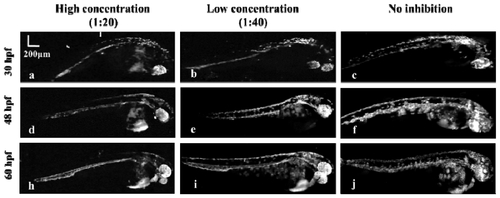
Evaluation of the pigment inhibitor. (a, b, c) MAP images of zebrafish at 30 hpf with high (a), low (b) concentrations of pigment inhibitor and without inhibition (c). (d, e, f) MAP images of the same zebrafish in (a, b, c) at 48 hpf. (e, f, j) MAP images of the same zebrafish in (a, b, c) at 60 hpf. |
Expression Data
Expression Detail
Antibody Labeling
Phenotype Data
Phenotype Detail
Acknowledgments
This image is the copyrighted work of the attributed author or publisher, and
ZFIN has permission only to display this image to its users.
Additional permissions should be obtained from the applicable author or publisher of the image.
Full text @ Biomed. Opt. Express