
FIGURE
Fig. S3
- ID
- ZDB-FIG-180109-15
- Publication
- Turrini et al., 2017 - Optical mapping of neuronal activity during seizures in zebrafish
- Other Figures
- All Figure Page
- Back to All Figure Page
Fig. S3
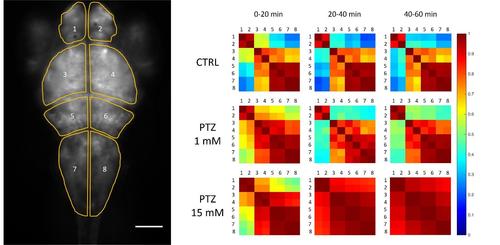
Cross-correlation maps of activity in different brain regions. Left. Regions of interest selected for analysis are shown overlaid with the fluorescence image; scale bar 100 μm. Right. Cross-correlation matrices (see Methods) measured at different time intervals during a one-hour recording in different conditions, as indicated. Each matrix shows color-coded mean correlation coefficients of three larvae, exposed to the same condition, during the same timeframe. |
Expression Data
Expression Detail
Antibody Labeling
Phenotype Data
Phenotype Detail
Acknowledgments
This image is the copyrighted work of the attributed author or publisher, and
ZFIN has permission only to display this image to its users.
Additional permissions should be obtained from the applicable author or publisher of the image.
Full text @ Sci. Rep.