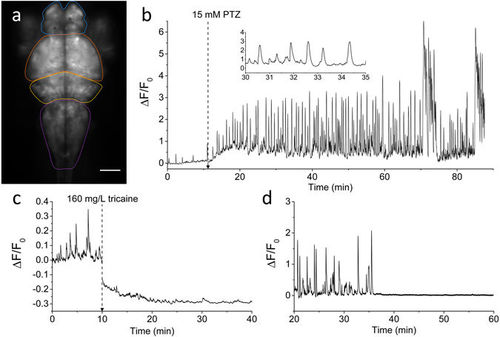
Brain activity recording with GCaMP6s. (a) Fluorescence image of the encephalon of a 4 dpf larva expressing GCaMP6s under elavl3 promoter. Scale bar: 100 µm. The four main zebrafish brain regions used for further analysis in the paper are highlighted (Telencephalon, blue; Optic tectum, orange; Cerebellum, yellow; Medulla, purple). (b) Time trace of fluorescence (ΔF/F0, see Methods for detail) in control conditions and after addition of 15 mM PTZ (at the time indicated). The fluorescence data are integrated over the whole brain of the larva and sampled at 5 Hz. The inset shows a shorter time interval of the trace to better display calcium peak shape and regularity. (c) ΔF/F0 trace of an experiment in which tricaine (160 mg/L) was added at the time indicated and the subsequent decay of activity was monitored. The ΔF/F0 values become negative after tricaine addition since the F0 reference level was measured in control conditions (see Methods for details). (d) ΔF/F0 trace showing sharp brain activity decay in a larva simultaneously treated with 15 mM PTZ and 5 μM TTX. After approximately 35 min upon drugs application, TTX action totally suppressed neuronal seizure activity induced by PTZ.
|
