
Fig. S6
- ID
- ZDB-FIG-180109-16
- Publication
- Turrini et al., 2017 - Optical mapping of neuronal activity during seizures in zebrafish
- Other Figures
- All Figure Page
- Back to All Figure Page
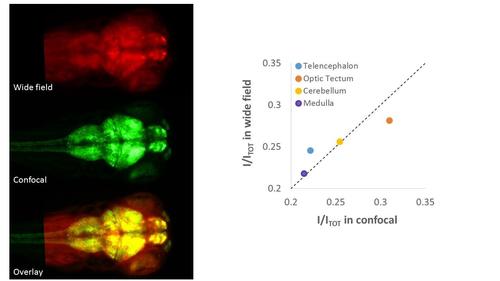
Evaluation of cross-talk between brain regions due to wide-field imaging. Imaging was performed on the same larva in wide field (left, top panel) and confocal (left, middle panel). The confocal image was constructed as the sum of 183 confocal planes (with 2 μm z-steps) encompassing the whole depth of the larva brain. This reconstruction is taken as a good reference for comparison with the wide field image, since each plane does not suffer from contributions of out-of-focus planes from adjacent brain regions at different depths. Comparison of the two images and observation of the overlay (left, bottom panel) demonstrates that the wide field image captures most of the relevant features of the encephalon as imaged with confocal microscope. A quantitative correlation between wide-field versus confocal intensities of the four regions analysed in the paper is shown in the right panel. Intensities are reported as percentage over the total intensity integrated on the whole brain. |