
Fig. 3
- ID
- ZDB-FIG-171115-11
- Publication
- Fame et al., 2016 - Directional cerebrospinal fluid movement between brain ventricles in larval zebrafish
- Other Figures
- All Figure Page
- Back to All Figure Page
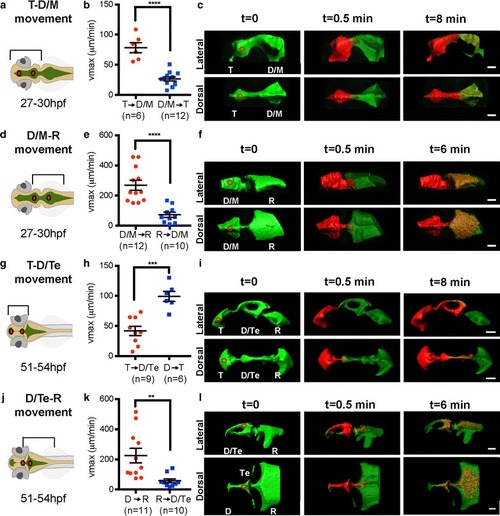
Bulk movement of CSF at early and late larval stages. a, d, g, j Schematics of brain ventricular regions analyzed. b At 27–30 hpf, the average vmax is significantly higher in the anterior to posterior (red) direction through the telencephalic-to-diencephalic/mesencephalic aqueduct than in the posterior to anterior direction (blue). c Overlaid thresholded volumes generated by Imaris (Bitplane) software of a representative 27–30 hpf T → D/M dataset. e At 27–30 hpf, the average vmax is significantly higher in the anterior to posterior (red) direction through the diencephalic/mesencephalic-to-rhombencephalic aqueduct than in the posterior to anterior direction (blue). f Overlaid thresholded volumes generated by Imaris (Bitplane) software of a representative 27–30 hpf D/M → R dataset. h At 51–54 hpf, through the telencephalic-to-diencephalic aqueduct, directionality is reversed such that the vmax is significantly higher in the posterior to anterior (blue) direction through the telencephalic-to-diencephalic aqueduct than in the anterior to posterior direction (red). i Overlaid thresholded volumes generated by Imaris (Bitplane) software of a representative 51–54 hpf T → D dataset. k At 51–54 hpf, the average vmax is significantly higher in the anterior to posterior (red) direction through the diencephalic-to-rhombencephalic aqueduct than in the posterior to anterior direction (blue). l Overlaid thresholded volumes generated by Imaris (Bitplane) software of a representative 51–54 hpf D → R dataset. Red circles indicate photoconversion region. Lines represent average vmax and error bars denote SEM. p value calculated using unpaired Student’s t test, **p < 0.001; ***p < 0.0005; ****p < 0.0001. T telencephalic ventricle, D/M diencephalic/mesencephalic ventricle, Te tectal ventricle, R rhombencephalic ventricle, hpf hours post-fertilization. Scale bar: 50 μm |