
Fig. 2
- ID
- ZDB-FIG-170907-47
- Publication
- Gao et al., 2017 - The signalling receptor MCAM coordinates apical-basal polarity and planar cell polarity during morphogenesis
- Other Figures
- All Figure Page
- Back to All Figure Page
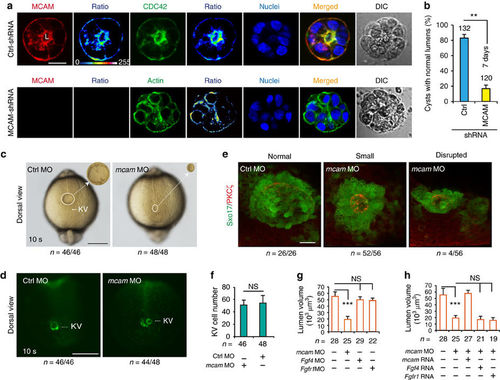
Mcam depletion disrupts lumenogenesis. (a,b) HEK293 cells transfected with either control pGPU6/Neo-shRNA vector or pGPU6/Neo-MCAM-shRNA were cultured on Matrigel for 5–7 days to enable cyst formation. Cyst nuclei and F-actin were labelled with DAPI and phalloidin, respectively. DIC means digital image of contrast. The fluorescent images were converted to 16-colour intensity images indicating the localization of MCAM, CDC42, or F-actin (calibration bar: signal intensity). L, lumen space; Scale bar, 20 μm. Data (mean±s.e.m., n=3) were analysed with unpaired Student’s t-test. **P value<0.01. (c,d) KV in Sox17:GFP zebrafish TG embryos injected with mcam MO or control MO into DFC. Embryos were collected at 10 s (somite) stage. In representative light micrographs (c), the area with KV was enlarged 4 times and shown as inset in the right hand corner. Scale bar, 250 μm. (e) mcam MO was injected into DFC of Sox17:GFP transgenic embryos. Lumen cells were immunolabeled with aPKC antibody (red). Representative fluorescence images show Sox17-GFP-labelled KV (green) and lumen cells (red). Scale bar, 20 μm. (f) KV cell numbers in DFCmcam MO embryos. Data (mean±s.e.m., n=3) were analysed with unpaired Student’s t-test and NS, not significant. (g) Comparison of KV lumen volumes in embryos with DFC injection of mcam, fgf4 or fgfr1 MO. KV lumen volumes were calculated using the measure stack tool of Image J software. Data are presented as mean±s.e.m. (n=3). One-way analysis of variance (ANOVA) with Tukey’s post-test. ***P value<0.001 and NS, not significant. (h) Rescue effects of mcam, fgf4 or fgfr1 mRNA on reduction of lumen volumes in DFCmcam MO embryos. Data are presented as mean±s.e.m. (n=3). One-way ANOVA with Tukey’s post-test. ***P value<0.001 and NS, not significant. |
| Gene: | |
|---|---|
| Antibody: | |
| Fish: | |
| Knockdown Reagent: | |
| Anatomical Terms: | |
| Stage: | 10-13 somites |
| Fish: | |
|---|---|
| Knockdown Reagent: | |
| Observed In: | |
| Stage: | 10-13 somites |