
Fig. 8
- ID
- ZDB-FIG-170809-9
- Publication
- Mesureur et al., 2017 - Macrophages, but not neutrophils, are critical for proliferation of Burkholderia cenocepacia and ensuing host-damaging inflammation
- Other Figures
- All Figure Page
- Back to All Figure Page
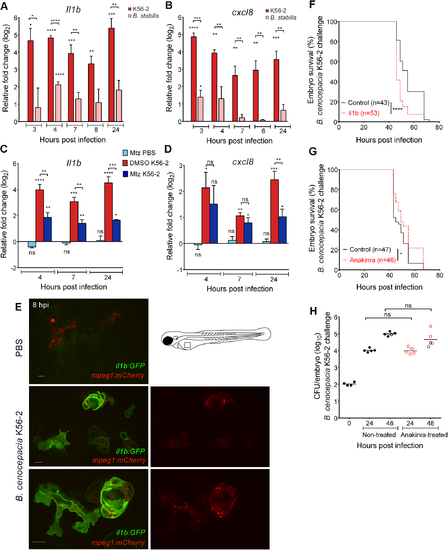
B. cenocepacia K56-2 induces robust pro-inflammatory Il1b expression that is dependent on macrophages. (A,B) Mean relative il1b (A) and cxcl8 (B) gene expression levels (qRT-PCR) in embryos injected with on average 250 CFU B. cenocepacia K56-2 (red bars) or on average 111 CFU B. stabilis LMG14294 (pink bars), normalized to a PBS-injected control group at each time point. Error bars represent mean with SEM of three biological replicates. Asterisks above each bar indicate significance compared to the PBS control at each time point, significance between groups per time point is indicated with a horizontal line. (C,D) mpeg1/umn+ embryos were pre-treated at 34 hpf for 15 h with DMSO or 5 mM Mtz. Randomized groups were injected with either PBS or with B. cenocepacia K56-2 (on average 150 CFU). Graphs show mean relative il1b (C) and cxcl8 (D) gene expression levels (qRT-PCR) normalized to the PBS-injected DMSO-treated group at each time point. Error bars represent mean with SEM of two biological replicates. See also S8 Fig. (E) Confocal stack images (green/red overlay (left panels) and red channel (right panels)) of il1b:GFP/mpeg1:mCherry embryos 8 h post iv injection with PBS, or B. cenocepacia K56-2 (DS-Red). Due to strong fluorescence of GFP in epithelial cells in the trunk and head region, images were taken over the yolk sac valley. Scale bars 10 μm. (F) Embryo survival (average inoculum 44 CFU, representative experiment) of control (black) and il1b knockdown embryos (red) injected iv with B. cenocepacia K56-2. (G,H) Embryo survival (G) and bacterial burden over time (H) of control (black) and Anakinra-treated embryos (red) injected iv with B. cenocepacia K56-2 (average inoculum 107 CFU for both groups). Representative experiment. (A-D, F-H) * p ≤ 0.05; ** p ≤ 0.01; *** p ≤ 0.001; **** p ≤ 0.0001; ns: non-significant. |
| Genes: | |
|---|---|
| Fish: | |
| Conditions: | |
| Anatomical Terms: | |
| Stage Range: | Prim-15 to Protruding-mouth |
| Fish: | |
|---|---|
| Conditions: | |
| Knockdown Reagent: | |
| Observed In: | |
| Stage Range: | Prim-15 to Protruding-mouth |