
Fig. S5
- ID
- ZDB-FIG-170809-16
- Publication
- Mesureur et al., 2017 - Macrophages, but not neutrophils, are critical for proliferation of Burkholderia cenocepacia and ensuing host-damaging inflammation
- Other Figures
- All Figure Page
- Back to All Figure Page
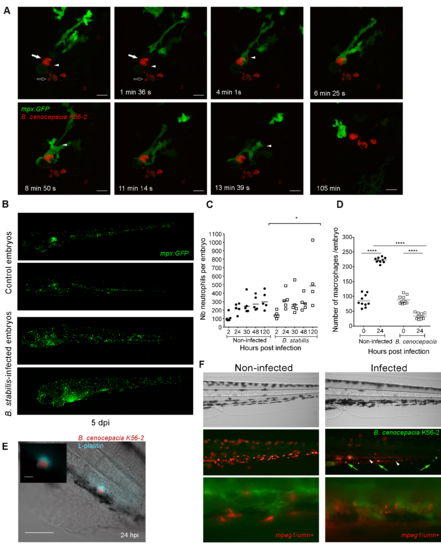
Related to Fig 3. Behaviour and fate of neutrophils and macrophages during acute and persistent infection. (A). Confocal stack images of a time series, first image ~20 hours after infection of an mpx:GFP embryo with B. cenocepacia K56-2. Patrolling neutrophil inspects heavily infected macrophage (white arrow). Individual bacteria (arrow head), possibly released from infected cell nearby (open arrow), are being moved around by the neutrophil. The last image shows the same area 90 minutes later with the infected macrophage still intact. (B,C) Mpx:GFP embryos (50 hpf) were injected with B. stabilis LMG14294. (B) Representative images of control and B. stabilis infected mpx:GFP embryos with increased neutrophil numbers. Neutrophils were more dispersed in B. stabilis-infected compared to non-infected control embryos, where most neutrophils were resting in the caudal hematopoietic tissue. (C) The number of neutrophils in infected and non-infected control embryos was determined by pixel counting at different time points after injection. Each data point represents one embryo. The graph represents one of the three experiments represented in Fig 3C, but includes an additional time point at 5 days post infection, which was not determined in the other 2 experiments. A percentage of embryos injected with B. stabilis contained more neutrophils than control embryos (see also (B)). *, p ≤ 0.05. (D) Mpeg1:mCherry embryos were injected with B. cenocepacia K56-2 (~45 CFU) and the number of macrophages was evaluated by pixel counting at 0 and 24 hpi (30 and 54 hpf, respectively). The results are related to the corresponding experiment shown in Fig 3D. Each data point represents one embryo. Significance was determined using a one-way Anova with Sidak’s Multiple Comparisons test. **** p ≤ 0.0001. Two independent experiments (n = 5). (E) Image showing B.cenocepacia K56-2 (red) in an L-plastin labelled macrophage (blue) at 24 hpi. Scale bar, 50 μm. Inset, magnification red/ blue filters, scale bar 10 μm. (F) Images (bright field, green/red overlay, and detailed image with red/green filter), of a non-infected mpeg1/umn+ embryo (left panels) and mpeg1/umn+ embryo (right panels) iv infected with B. cenocepacia K56-2 (green, arrows) at 24 hpi. The images are similarly treated to enhance the red fluorescence to visualize the mCherry positive debris. The close up shows individual macrophages (left panel, red), and red fluorescent debris (arrow heads). Related to Fig 3F. |