
Fig. 3 S2
- ID
- ZDB-FIG-170609-67
- Publication
- Gong et al., 2017 - The Sec14-like phosphatidylinositol transfer proteins Sec14l3/SEC14L2 act as GTPase proteins to mediate Wnt/Ca2+ signaling.
- Other Figures
- All Figure Page
- Back to All Figure Page
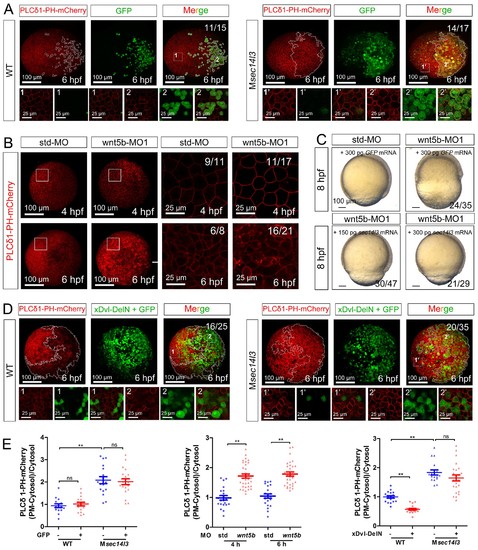
wnt 5b-MO induced phenotypes can be restored by sec14l3 mRNA. (A) GFP mRNA injection has no effect on the PM located PIP2 bound by PLCδ1-PH-mCherry in wild-type or Msec14l3 mutant embryos. White polygons outline GFP expressed cells at 6 hpf and single z-stack pictures (z = 6) from numbered regions in the animal pole view whole embryo panels (3D view of z-stacks) are enlarged. Scale bars, 100 μm for the whole embryos and 25 μm for the enlarged panels. (B) Accumulation of PIP2 bound by PLCδ1-PH-mCherry in the PM of wnt5b morphants at 4 and 6 hpf. The shown pictures are immunofluorescent images of embryos viewed from animal pole. Single z-stack pictures (z = 6 for 4 hpf, z = 8 for 6 hpf) from the boxed areas in the left columns (3D view of z-stacks) are enlarged in the right columns. Scale bars, 100 μm for the whole embryos; 25 μm for the enlarged panels. (C) Sec14l3 overcomes the CE defects of wnt5b morphants. 150 pg and 300 pg sec14l3 mRNA were used for rescue assays. Embryos injected with 300 pg GFP mRNA were used as negative controls. Embryos are lateral views. Scale bars, 100 μm. (D) Sec14l3 depletion compromises xDsh-DelN-induced degradation of PIP2 in the PM. Mosaic expression of 100 pg xDsh-DelN mRNA were created in embryos with even distribution of PLCδ1-PH-mCherry mRNA to probe PIP2 change. Single z-stack pictures (z = 8) from numbered regions in the animal pole view whole embryo panels (3D view of z-stacks) are enlarged. Scale bars, 100 μm for the whole embryos; 25 μm for the enlarged panels. (E) Quantification of PM PIP2 accumulation in embryonic cells of (A, B and D). The PM PIP2 accumulation was respectively reflected by the PLCδ1-PH-mCherry intensity ratio of (PM-Cytosol)/Cytosol. Embryos from three independent experiments were calculated (see also Figure 3—source data 1, **p<0.01). |