
Fig. 1
- ID
- ZDB-FIG-170609-61
- Publication
- Gong et al., 2017 - The Sec14-like phosphatidylinositol transfer proteins Sec14l3/SEC14L2 act as GTPase proteins to mediate Wnt/Ca2+ signaling.
- Other Figures
- All Figure Page
- Back to All Figure Page
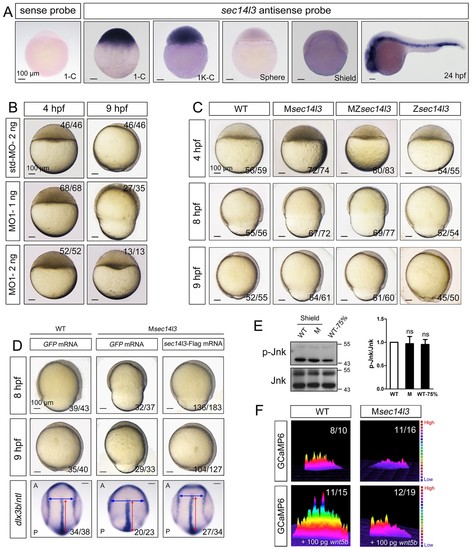
Sec14l3 depletion impairs CE movements and Wnt/Ca2+ signaling in zebrafish. (A) Spatiotemporal expression pattern of sec14l3. Embryos were laterally viewed with animal pole to the top or with anterior to the left. Scale bars, 100 μm. (B) Morphological defects in sec14l3 morphants during gastrulation. Scale bars, 100 μm. (C) Morphological defects in Msec14l3, MZsec14l3 and Zsec14l3 mutants. Scale bars, 100 μm. (D) sec14l3 mRNA rescue assay. 150 pg sec14l3 mRNA was injected into Msec14l3 mutants for rescue, and then the morphology and dlx3b/ntl marker gene expression were examined. First two panels: lateral views; last panel: dorsal views. Blue and red two-way arrows indicate the width of neural plate and the length of notochord respectively. Scale bars, 100 μm. (E) Phosphorylation level of Jnk in Msec14l3 mutant embryos. p-Jnk (Thr183/Tyr185) and total Jnk were examined at the shield (Morphology comparable) and 75% epiboly stage (Time point comparable) by western blot. Quantification of relative protein levels is shown on the right, represented by mean ± SEM in three separate experiments (see also Figure 1—source data 1, ns, non-significant). (F) Differential induction of calcium transient activity in zebrafish embryos. Representative calcium release profiles of embryos at the sphere stage in wild-type and Msec14l3 mutant background with or without wnt5b mRNA overexpression. The color bar represents the number of transients: red represents high numbers, blue represents lower numbers, and the peaks represent more active regions. In all panels, the ratio in the right corner indicated the number of embryos with altered phenotypes/the total number of observed embryos. |
| Genes: | |
|---|---|
| Antibodies: | |
| Fish: | |
| Anatomical Terms: | |
| Stage Range: | 1-cell to Prim-5 |
| Fish: | |
|---|---|
| Knockdown Reagent: | |
| Observed In: | |
| Stage Range: | Sphere to 90%-epiboly |