
Fig. S6
- ID
- ZDB-FIG-170609-48
- Publication
- Theodore et al., 2017 - Distinct Roles for Matrix Metalloproteinases 2 and 9 in Embryonic Hematopoietic Stem Cell Emergence, Migration, and Niche Colonization
- Other Figures
- All Figure Page
- Back to All Figure Page
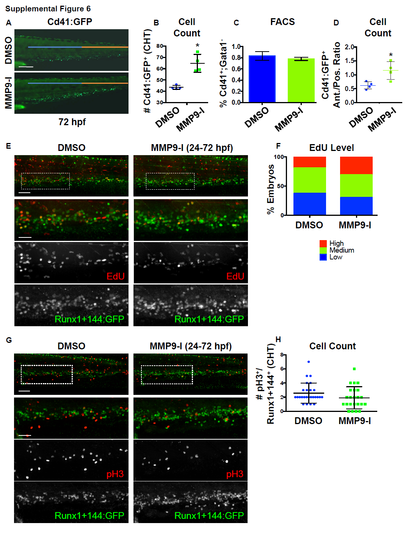
Mmp9 inhibition impacts HSPC localization and number in the CHT, independent of alterations in cell proliferation. Related to Figure 6.
A) In vivo imaging of Tg(-6.0itga2b:egfp) embryos showed MMP9-I treatment (5μM,12-72 hpf) increased the appearance of Cd41+ HSPCs in the CHT region, including preferential accumulation in the anterior (blue bar) versus posterior (orange bar) half of the hematopoietic niche. B) Quantification of the phenotype shown in S6A via manual counts of the number of Cd41:GFP+ cells per entire CHT region (DMSO: 43.5 ±1.73; MMP9-I: 64.75 ±7.93, *p<0.05, 2-tailed t-test, n≥4 embryos/condition). Error bars: mean ± SD. C) FACS for Cd41:GFP+,Gata1:dsRed- cells (with negative thrombocyte selection) showed no difference in whole embryo HSPC numbers at 72 hpf with MMP9-I exposure (12-72 hpf) compared to control (DMSO: 0.83 ±0.077; MMP9-I: 0.781 ±0.028, p=0.328, 2-tailed t-test, n≥5 embryos/sample, >3 replicates/condition). Error bars: mean ± SD. D) Quantification of the localization phenotype observed in S6A via manual count Cd41:GFP+ HSPCs in each half of the CHT at 72 hpf revealed an increase in the anterior: posterior cell number ratio with Mmp9 (12-72 hpf) inhibition (DMSO: 0.62 ±0.132; MMP9-I: 1.16 ±0.317, *p<0.05, 2-tailed t-test, nvalue as in S6B). Error bars: mean ± SD. E) EdU labeling in Tg(runx1+23(144-235):egfp) embryos showed no change in the level of double positive EdU/Runx1+144 staining in the CHT after MMP9-I treatment (24-72 hpf). F) Qualitative phenotypic distribution of total embryos from S6E scored with high, medium, or low EdU staining level at 72 hpf (n≥20 embryos/condition). G) pH3 staining in Tg(runx1+23(144-235):egfp) embryos showed no alteration in the number of double positive pH3/Runx1+144 cells in the CHT after MMP9-I treatment (24-72 hpf). H) Quantification of the phenotype in S6G via manual counts of the number of pH3+/Runx1+144:GFP+ HSPCs per CHT in control and MMP9-I treated embryos (DMSO: 2.58 ±1.42; MMP9-I: 1.91 ±1.56; p=0.13, 2-tailed t-test; n≥20 embryos/condition). Error bars: mean ± SD. Scale bars: 100μm. |